Free Access
Fig. 10
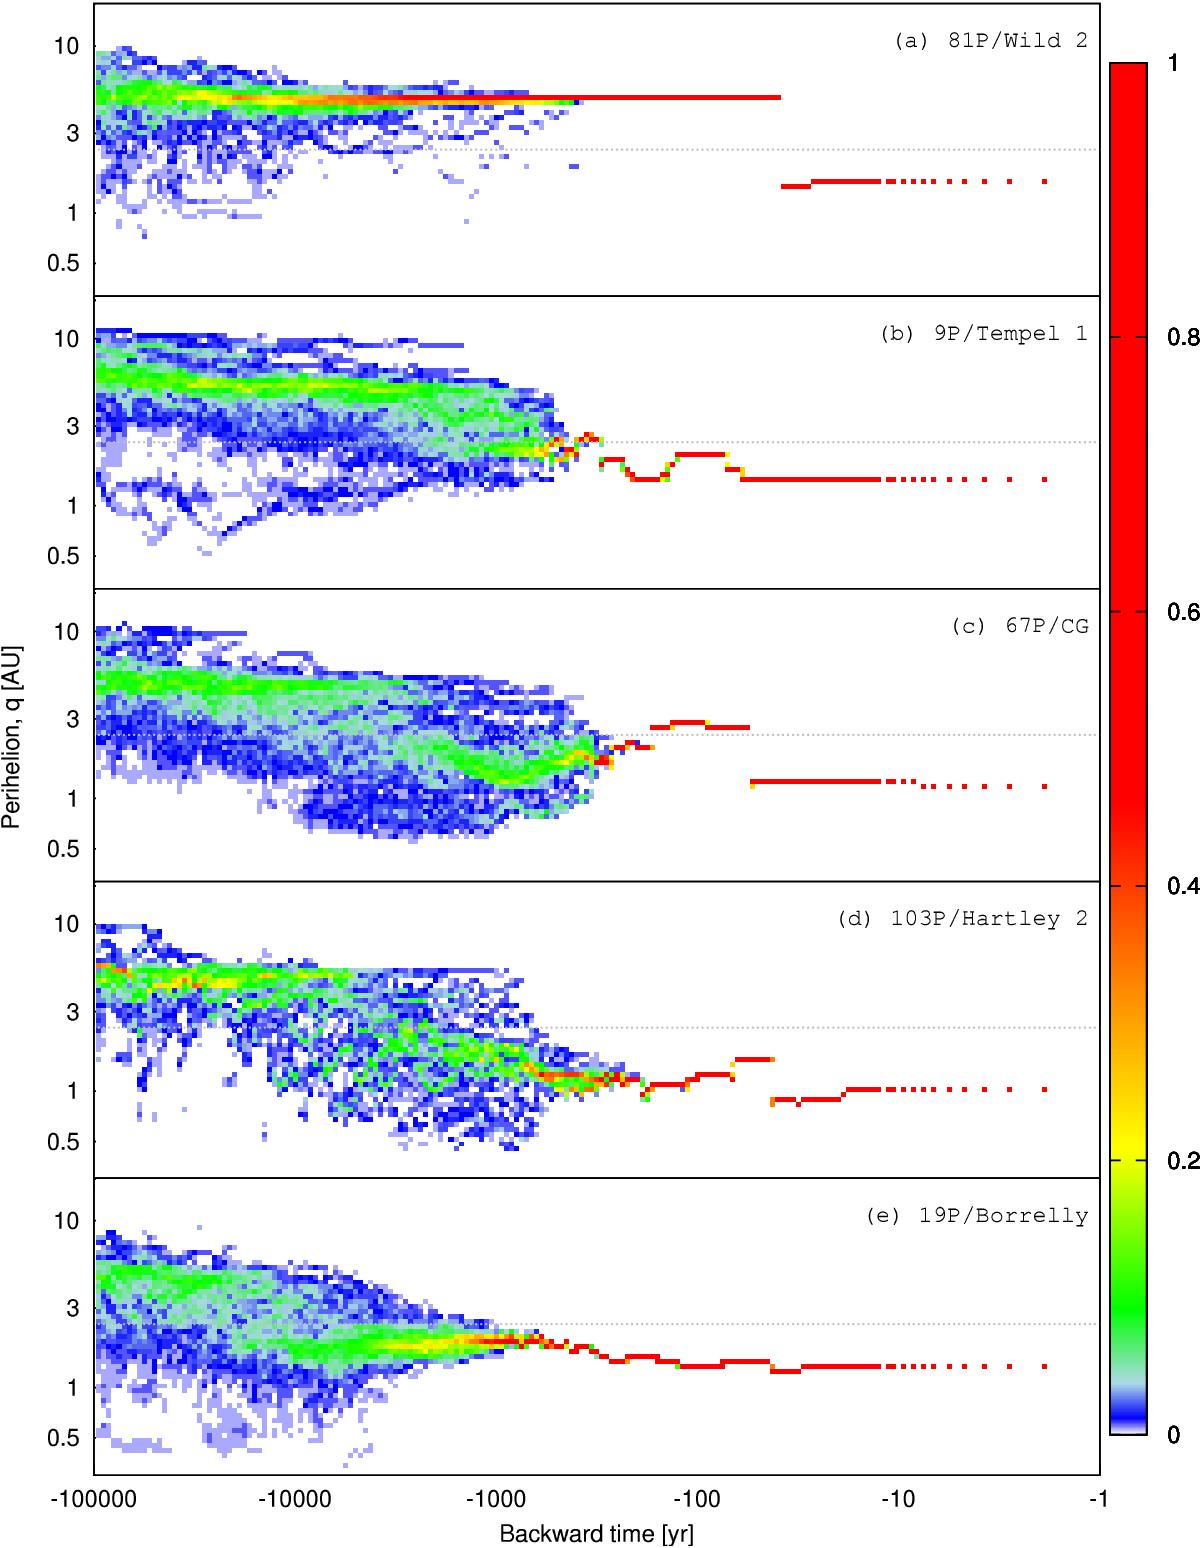
Comparison of the probable orbital evolutionary histories over the past 100 000 yr of five short-period comets visited by spacecraft. The color scale denotes the probability of orbital distribution of a comet in a certain time interval.
Current usage metrics show cumulative count of Article Views (full-text article views including HTML views, PDF and ePub downloads, according to the available data) and Abstracts Views on Vision4Press platform.
Data correspond to usage on the plateform after 2015. The current usage metrics is available 48-96 hours after online publication and is updated daily on week days.
Initial download of the metrics may take a while.