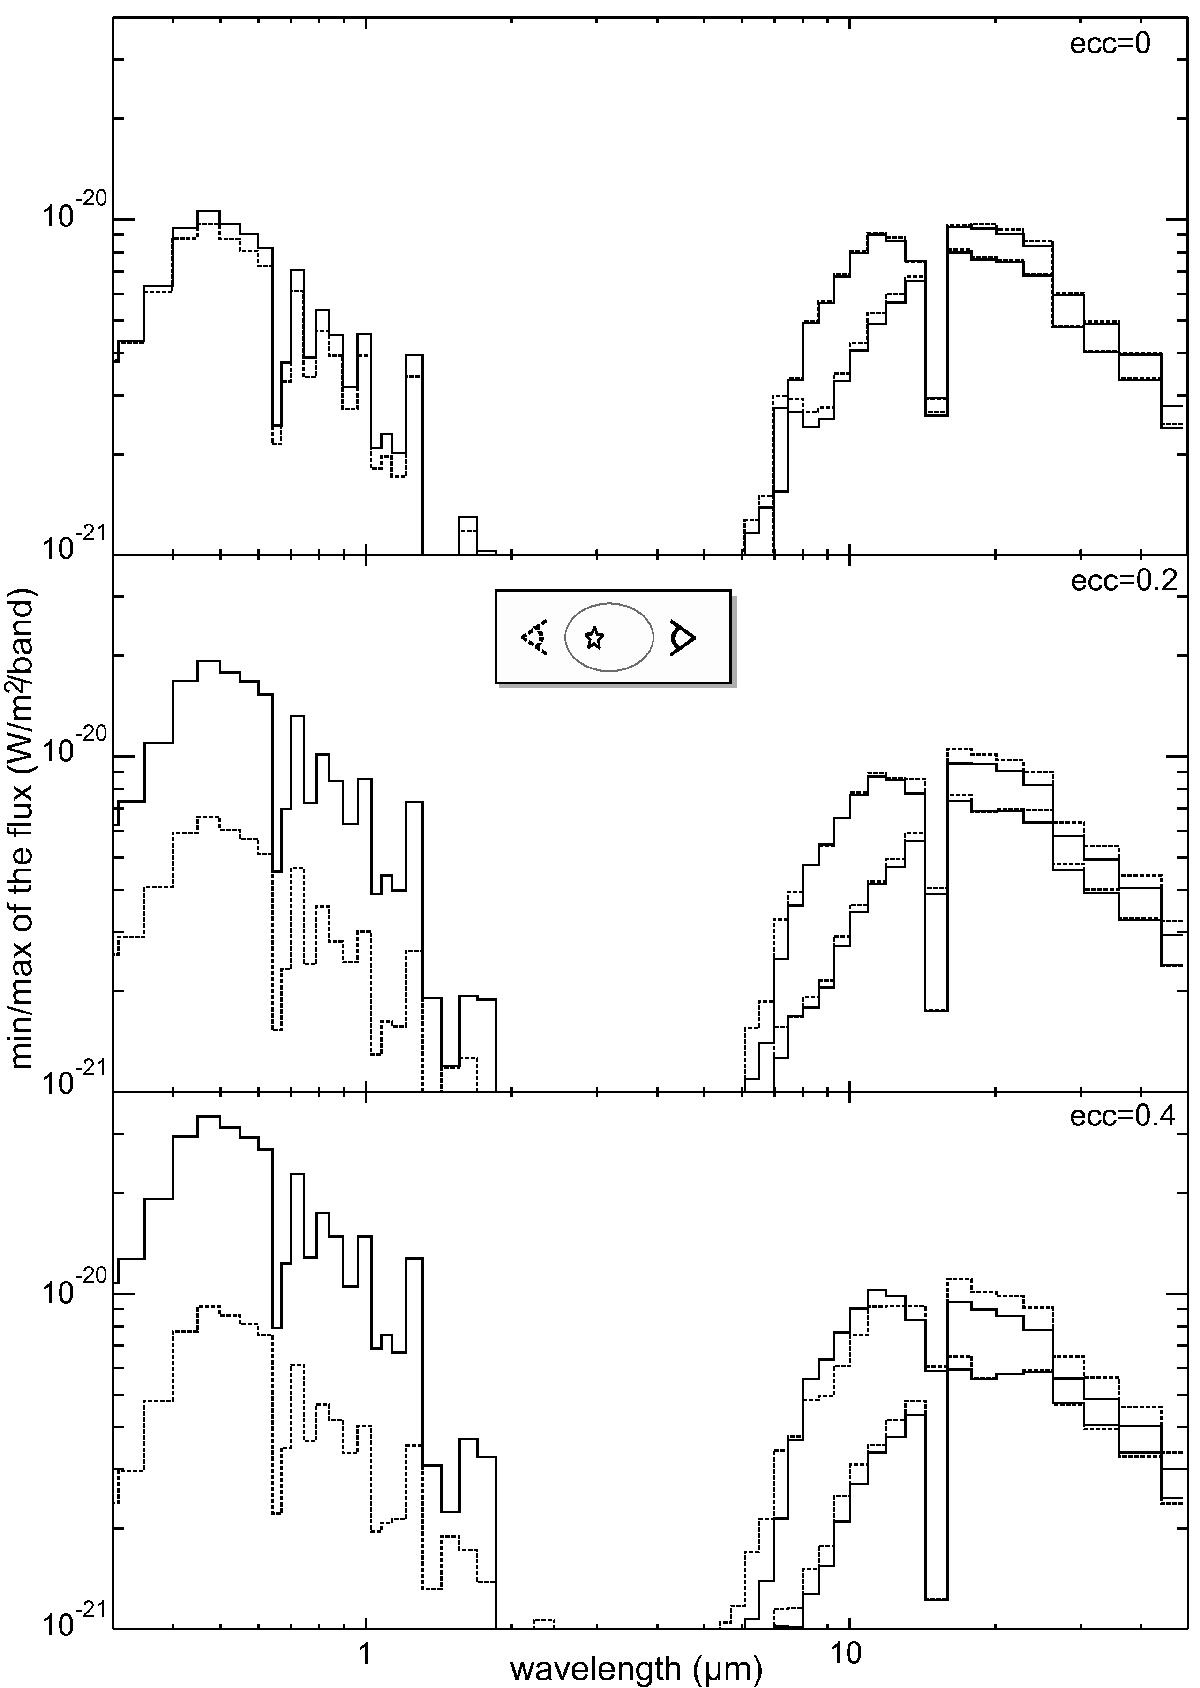
Fig. 14

Spectral variability. These graphs show, for L⋆ = L⊙ and e = 0, 0.2, and 0.4, the maximum and minimum of the flux in each band received during one orbit. Flux is given at 10 pc. For the reflected light, the minimum is zero as the observer is in the plane of the orbit (inclination = 90°). Superior conjunction occurs at periastron for solid lines and at apoastron for dashed lines. For the circular case (top), solid and dashed lines indicate two arbitrary observer directions separated by 180° and, in this case, the difference between the two curves is only due to stochastic meteorological variations.
Current usage metrics show cumulative count of Article Views (full-text article views including HTML views, PDF and ePub downloads, according to the available data) and Abstracts Views on Vision4Press platform.
Data correspond to usage on the plateform after 2015. The current usage metrics is available 48-96 hours after online publication and is updated daily on week days.
Initial download of the metrics may take a while.


