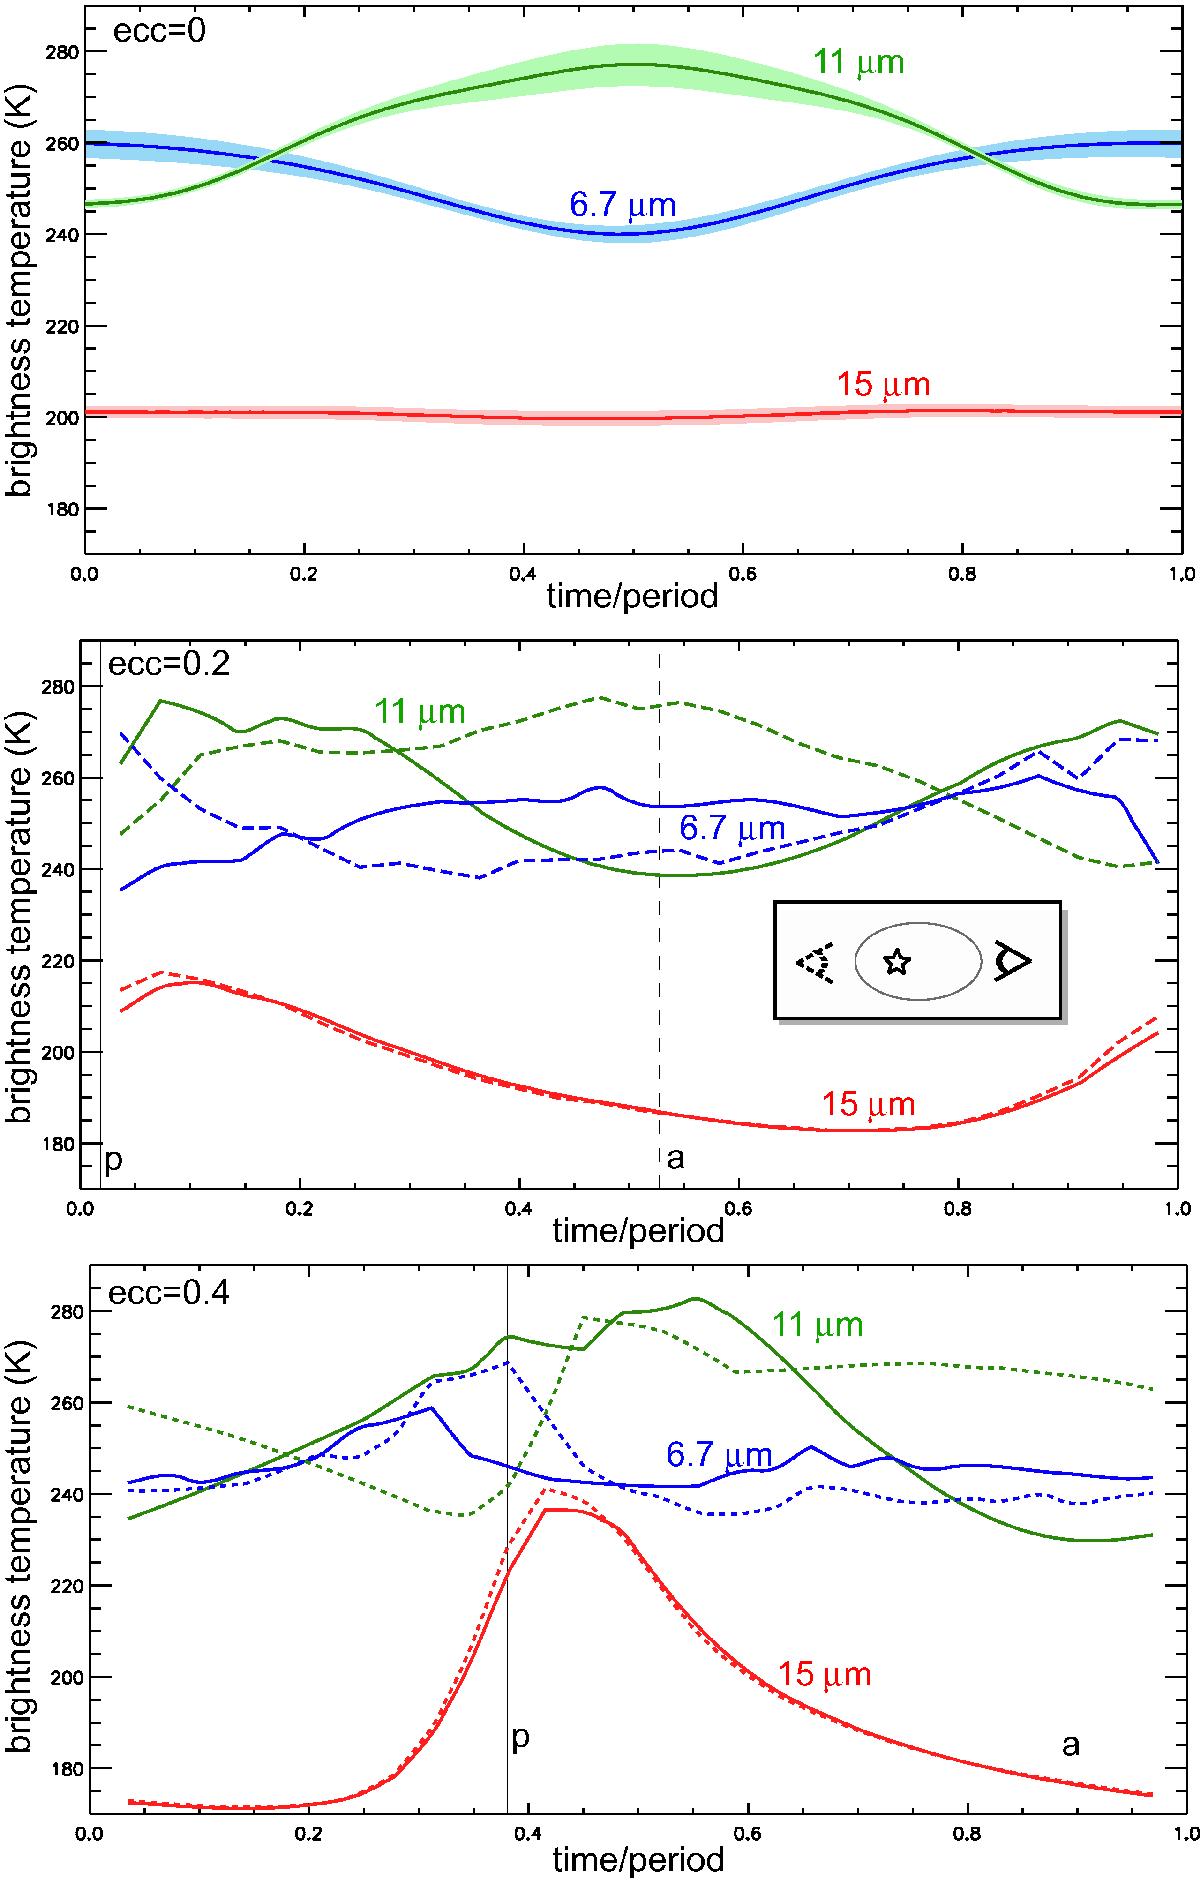
Fig. 12

Thermal phase curves in the 6.7, 11, and 15 μm bands obtained for one orbit, for three eccentricities, and two observation geometries. In the circular case, lightcurves are centered on the superior conjunction (dayside in view) and are time-averaged while the gray area is the 1σ variability due to meteorology. For a given eccentricity, the same orbit is used for both observation geometries. The periastron (p) and apoastron (a) are indicated by vertical lines.
Current usage metrics show cumulative count of Article Views (full-text article views including HTML views, PDF and ePub downloads, according to the available data) and Abstracts Views on Vision4Press platform.
Data correspond to usage on the plateform after 2015. The current usage metrics is available 48-96 hours after online publication and is updated daily on week days.
Initial download of the metrics may take a while.


