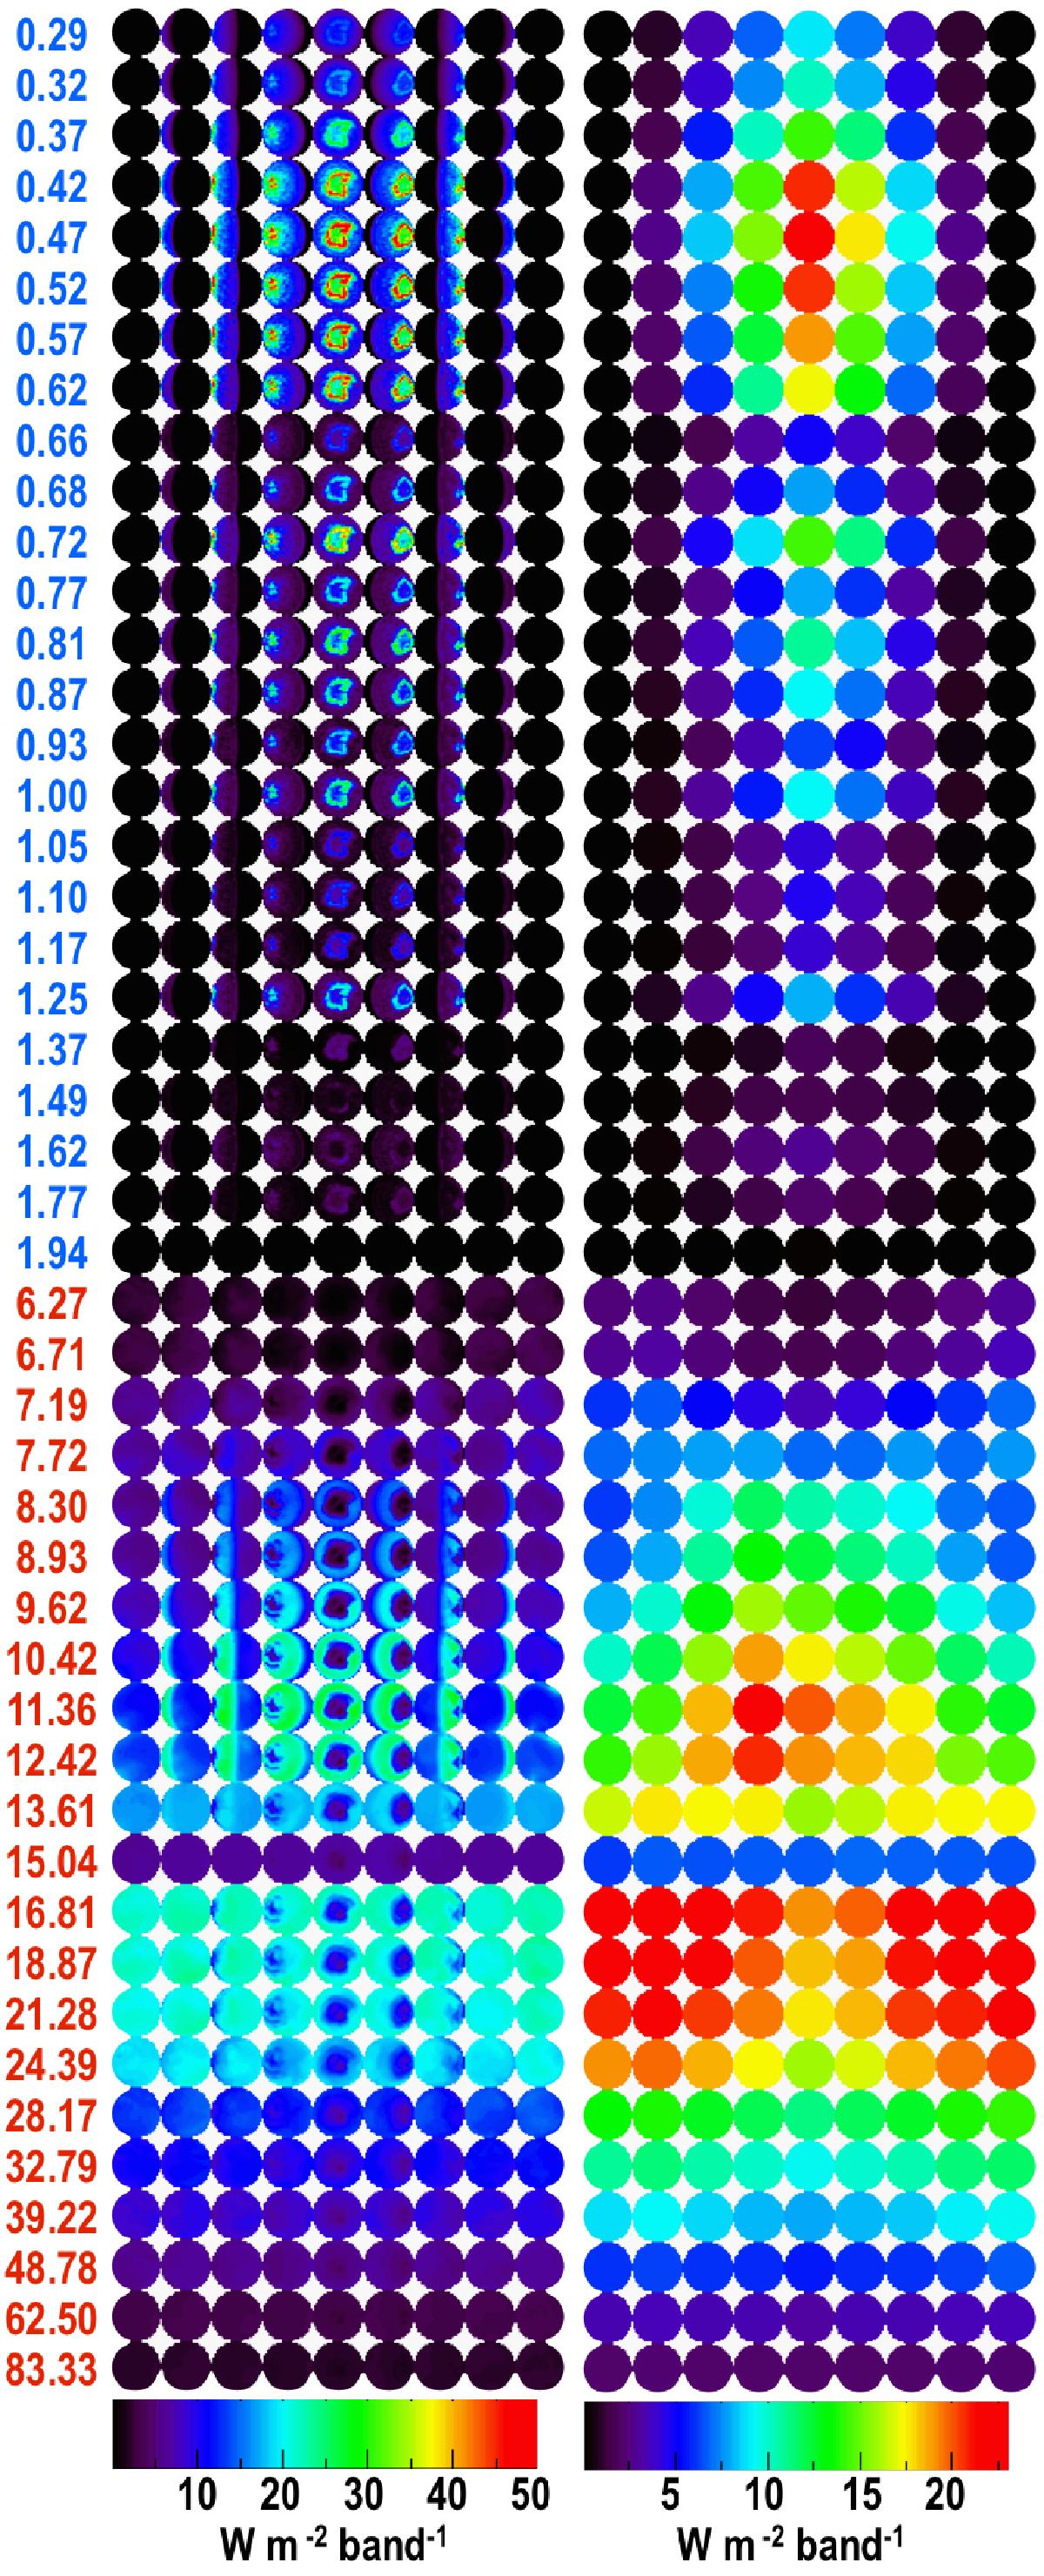
Fig. 11

Maps of TOA fluxes as seen by a distant observer for one given orbit and one observation geometry (1 L⊙, circular case). Each line represents one full orbit observed in one band (with the superior conjunction at the center). Each column represents a spectrum of the planet at the GCM resolution at a given orbital phase. The central wavelength of the bands is given in μm on the left. We note the gap between short (scattered light, in blue) and long (thermal emission, in red) wavelengths. In the right panel, the averaged spatially unresolved flux is given with a different color scale (owing to a smaller range of values).
Current usage metrics show cumulative count of Article Views (full-text article views including HTML views, PDF and ePub downloads, according to the available data) and Abstracts Views on Vision4Press platform.
Data correspond to usage on the plateform after 2015. The current usage metrics is available 48-96 hours after online publication and is updated daily on week days.
Initial download of the metrics may take a while.


