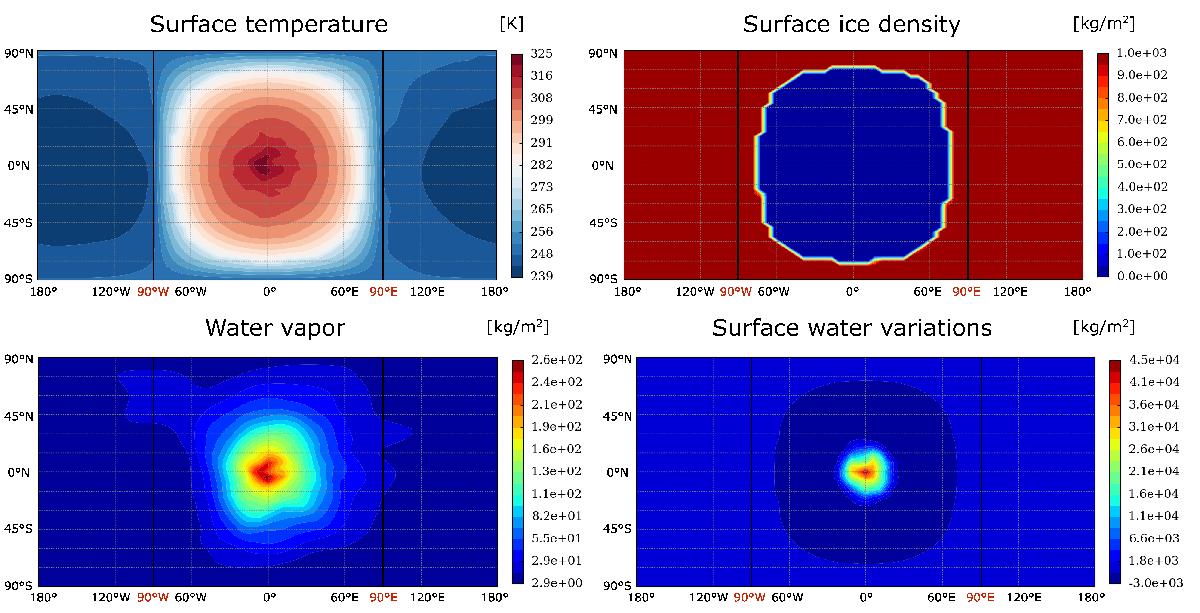
Fig. 1

Maps of surface temperature, ice density, amount of water vapor integrated on a column, and precipitation for a planet around a 1 L⊙ star on a circular orbit. The terminator (the longitudes of 90°W and 90°E) is shown in black. For the map showing the surface water variation, a negative value means that liquid water disappears (evaporation or freezing) and a positive value means that liquid water appears (rain or melting). For the map showing the surface ice density, a density of 1000 kg/m2 corresponds to a 1000 mm = 1 m thick ice layer.
Current usage metrics show cumulative count of Article Views (full-text article views including HTML views, PDF and ePub downloads, according to the available data) and Abstracts Views on Vision4Press platform.
Data correspond to usage on the plateform after 2015. The current usage metrics is available 48-96 hours after online publication and is updated daily on week days.
Initial download of the metrics may take a while.


