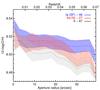
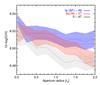
Fig. 7

Left: mean values for oxygen abundance from the central spaxel (value at 0 arcsec) to the total spectra (value at 39 arcsec), increasing the aperture in steps of 3 arcsec. Error bands are errors of the mean values. The upper x-axis shows where the aperture with 3′′ diameter is projected for different redshifts. Right: same measurements, but normalizing the unit of the aperture to the effective radius of the galaxies.
Current usage metrics show cumulative count of Article Views (full-text article views including HTML views, PDF and ePub downloads, according to the available data) and Abstracts Views on Vision4Press platform.
Data correspond to usage on the plateform after 2015. The current usage metrics is available 48-96 hours after online publication and is updated daily on week days.
Initial download of the metrics may take a while.