Fig. 8
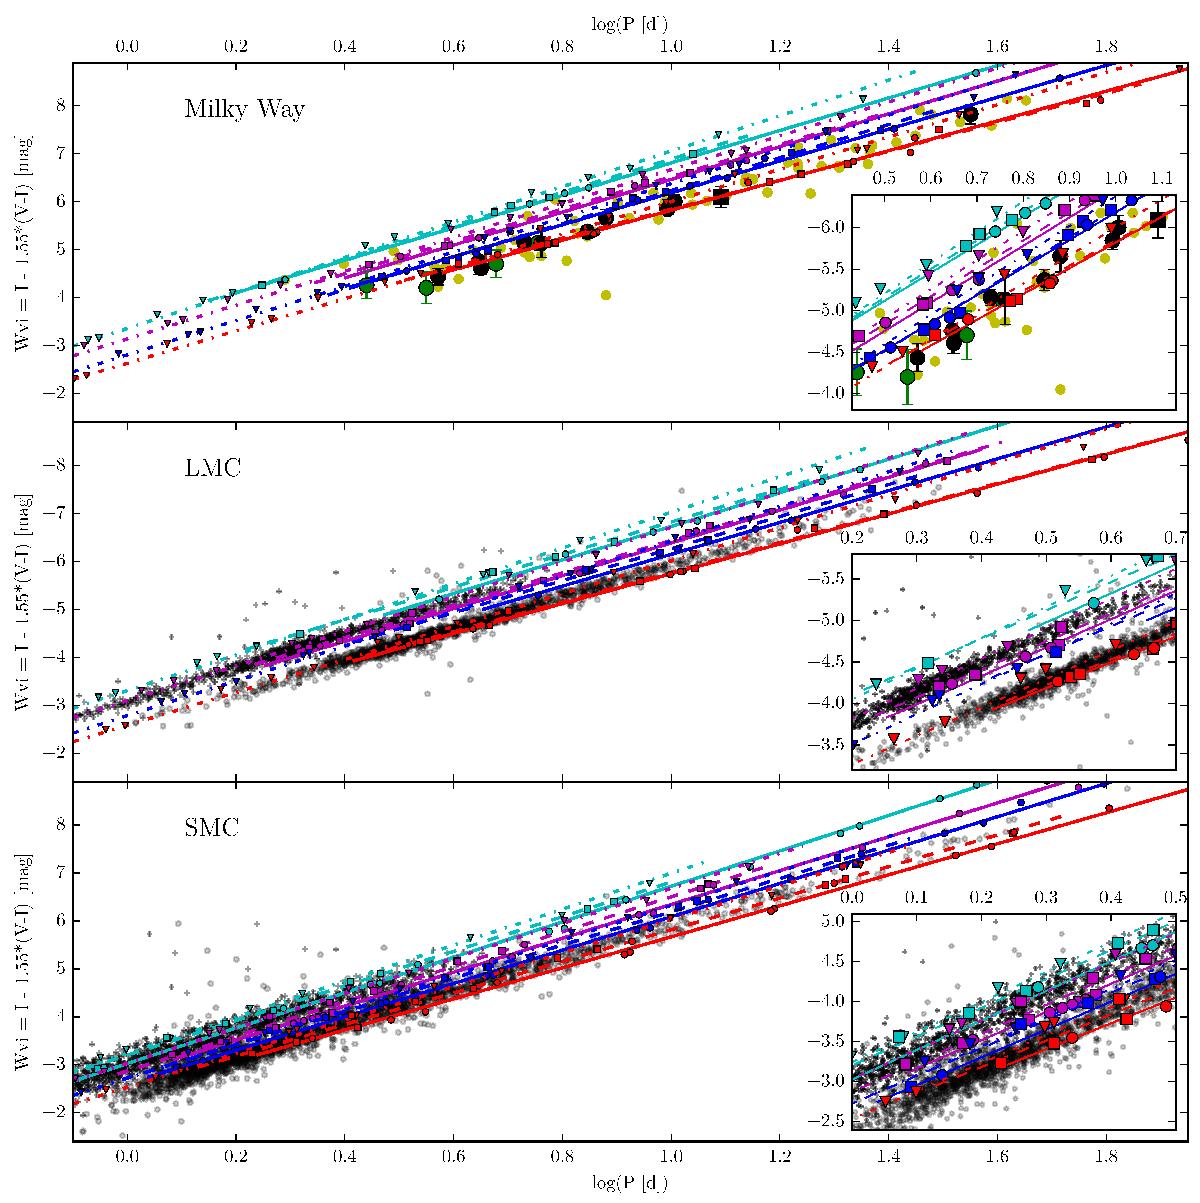
Comparison between predicted PLRs and observed PL distributions. We show separate theoretical PLRs near blue and red edges, and for the three crossings. Each PLR is derived by fitting models of all rotation velocities together, cf. Table 2. We use the “reddening-free” Wesenheit index WVI to compare the theoretical relations to Milky Way, LMC, and SMC Cepheids (top to bottom panels as labeled). First, second, and third crossing predictions are shown as triangles, squares, and circles and fitted relations are drawn as dash-dotted, dashed, and solid lines over a slightly longer period range (±0.1 in log P) for clarity. Hot and cool edges are drawn in blue and red for fundamental mode models, and in cyan and magenta for first overtone models. Top panel: empirical data shown are from Benedict et al. (2007, black circles with errors), van Leeuwen et al. (2007, green circles with errors), Storm et al. (2011, yellow scatter points), and Casertano et al. (2015, black square with errors). Center and bottom panels: OGLE-3 LMC and SMC Cepheids (Soszynski et al. 2008; Soszyński et al. 2010), for which absolute magnitudes are calculated using distance moduli of 18.494 and 18.965 based on eclipsing binary distances (Pietrzyński et al. 2013; Graczyk et al. 2014). In the LMC and SMC panels, fundamental mode Cepheids are shown as filled circles, and first overtone Cepheids as filled pluses. Predictions for short-period fundamental mode Cepheids are limited by the neglected curvature of the red IS edge (cf. Sect. 3.1) and the finite mass resolution of the model grid (cf. Sect. 3.2). The increased scatter among SMC Cepheids due to depth effects is clearly evident.
Current usage metrics show cumulative count of Article Views (full-text article views including HTML views, PDF and ePub downloads, according to the available data) and Abstracts Views on Vision4Press platform.
Data correspond to usage on the plateform after 2015. The current usage metrics is available 48-96 hours after online publication and is updated daily on week days.
Initial download of the metrics may take a while.