Fig. 4
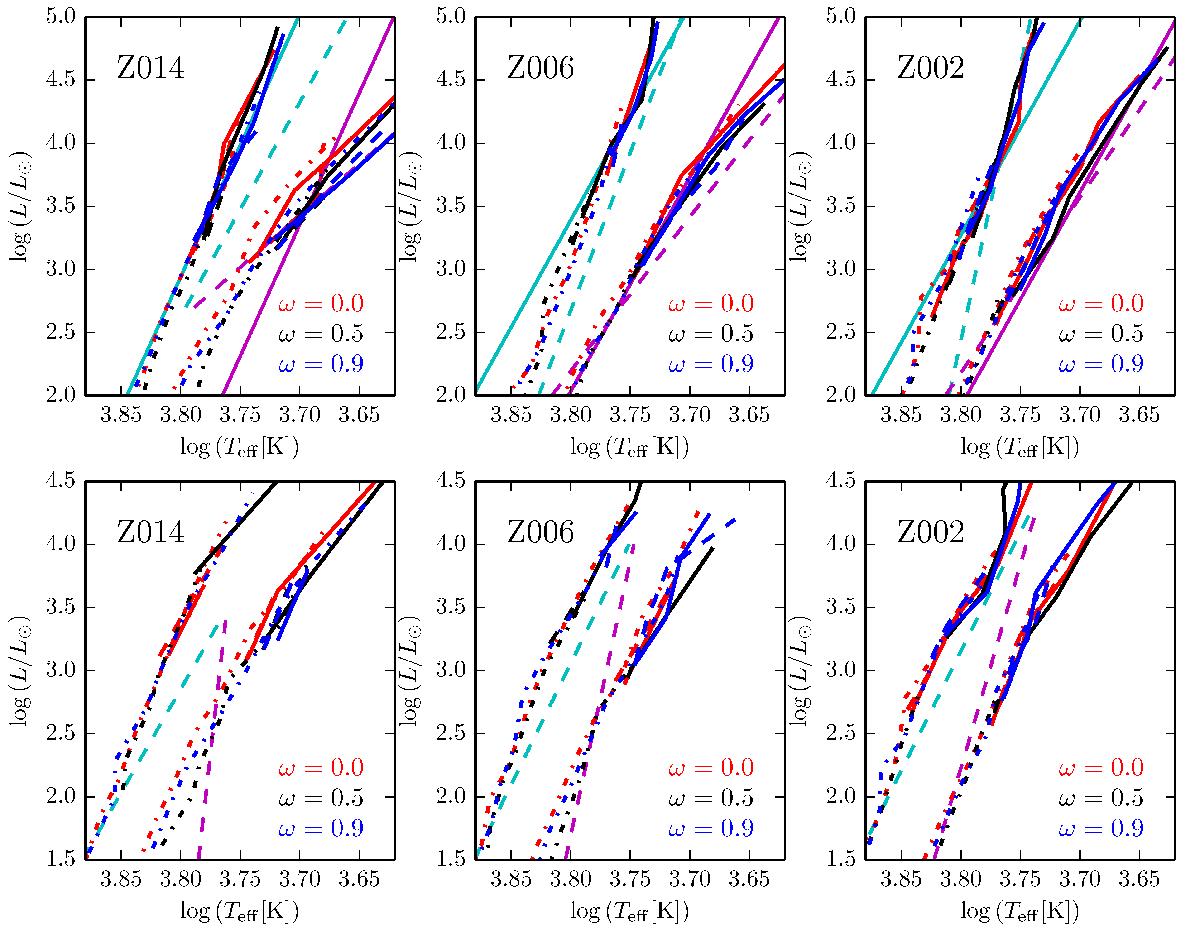
Comparison of our IS boundaries with the literature for both fundamental mode Cepheids (upper panels) and first overtone Cepheids (lower panels). The blue edge shown is computed without the frozen convection assumption. Metallicity decreases over the panels from left to right, as indicated. Our IS boundaries are drawn in red, black, and blue for ω = 0.0, 0.5, and 0.9, respectively. First crossings are drawn as dash-dotted, second crossings as dashed, and third crossings as solid lines. Theoretically computed IS boundaries by Bono et al. (2005, noncanonical models computed for Z = 0.02 are shown as cyan and magenta dashed lines for the hot and cool edge, and empirical boundaries by Tammann et al. (2003, fundamental modes only) are shown as solid cyan and magenta lines for hot and cool edges.
Current usage metrics show cumulative count of Article Views (full-text article views including HTML views, PDF and ePub downloads, according to the available data) and Abstracts Views on Vision4Press platform.
Data correspond to usage on the plateform after 2015. The current usage metrics is available 48-96 hours after online publication and is updated daily on week days.
Initial download of the metrics may take a while.