Fig. 17
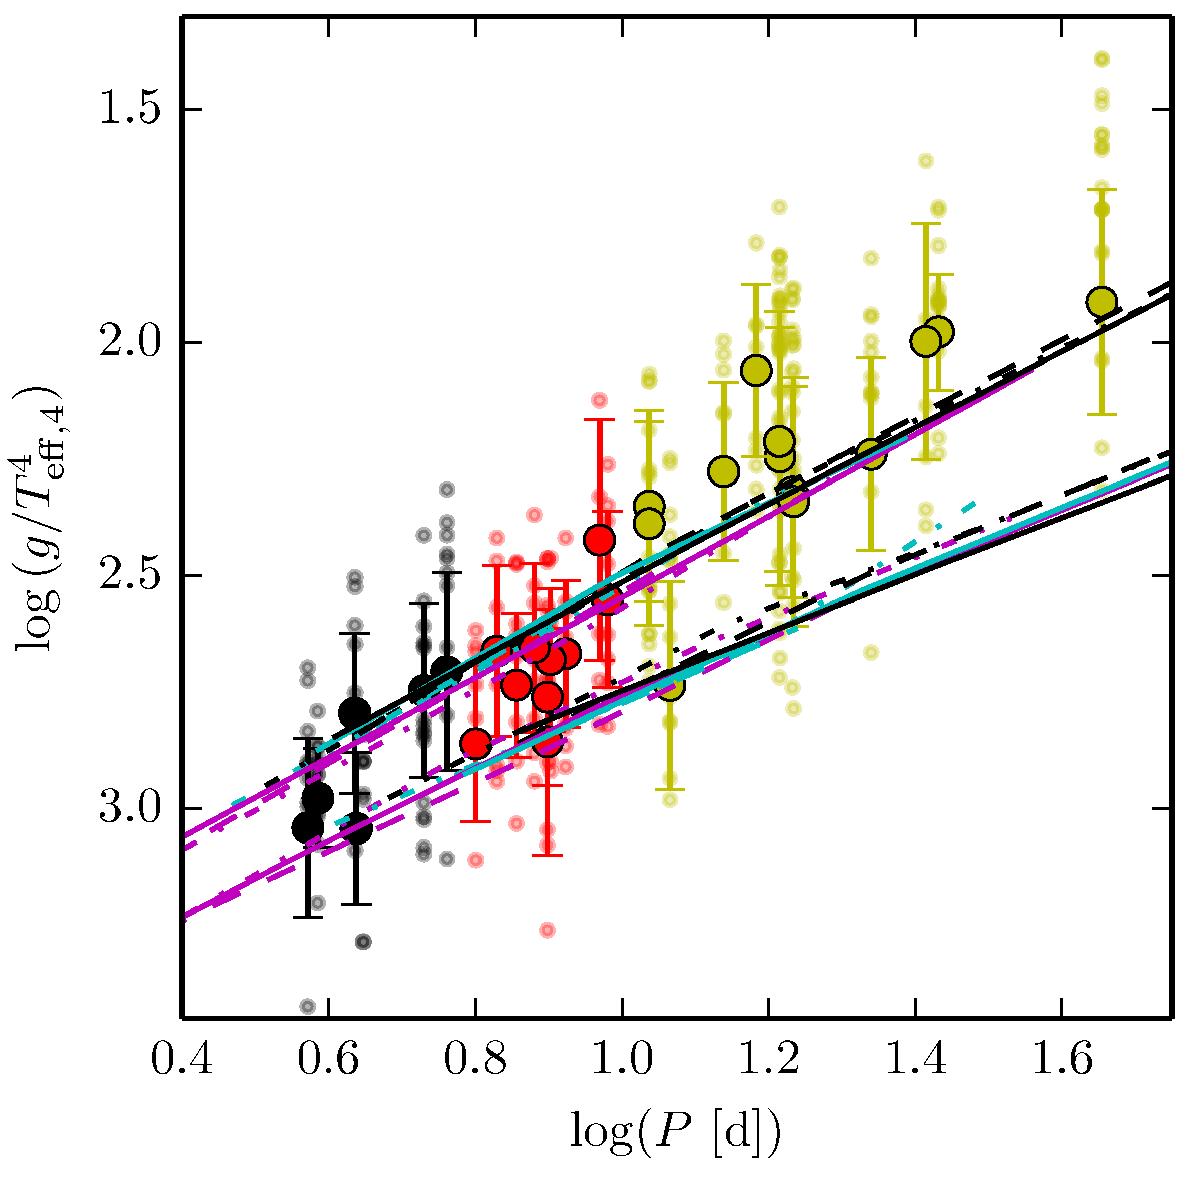
FWGLR for classical fundamental mode Cepheids: predictions (lines, Z = 0.014) and observations (circles). Line styles (dash-dotted, solid, and dashed) represent different initial rotation rates (non-rotating, average, fast), and crossing numbers (first, second, and third) are shown with different colors (magenta, cyan, and black). Data shown are from: Luck & Andrievsky (2004), Kovtyukh et al. (2005), Andrievsky et al. (2005). Phase-dependent data are drawn as transparent circles. Phase-averaged values are shown as errorbars with rough estimates of uncertainties (standard deviation of individual values, centered on center value of observed range). Agreement between predictions and observations is excellent for periods below 10 d. Periods longer than 10 d (yellow errorbars, data from Kovtyukh et al. 2005) appear systematically offset to lower values of ![]() .
.
Current usage metrics show cumulative count of Article Views (full-text article views including HTML views, PDF and ePub downloads, according to the available data) and Abstracts Views on Vision4Press platform.
Data correspond to usage on the plateform after 2015. The current usage metrics is available 48-96 hours after online publication and is updated daily on week days.
Initial download of the metrics may take a while.