Fig. 16

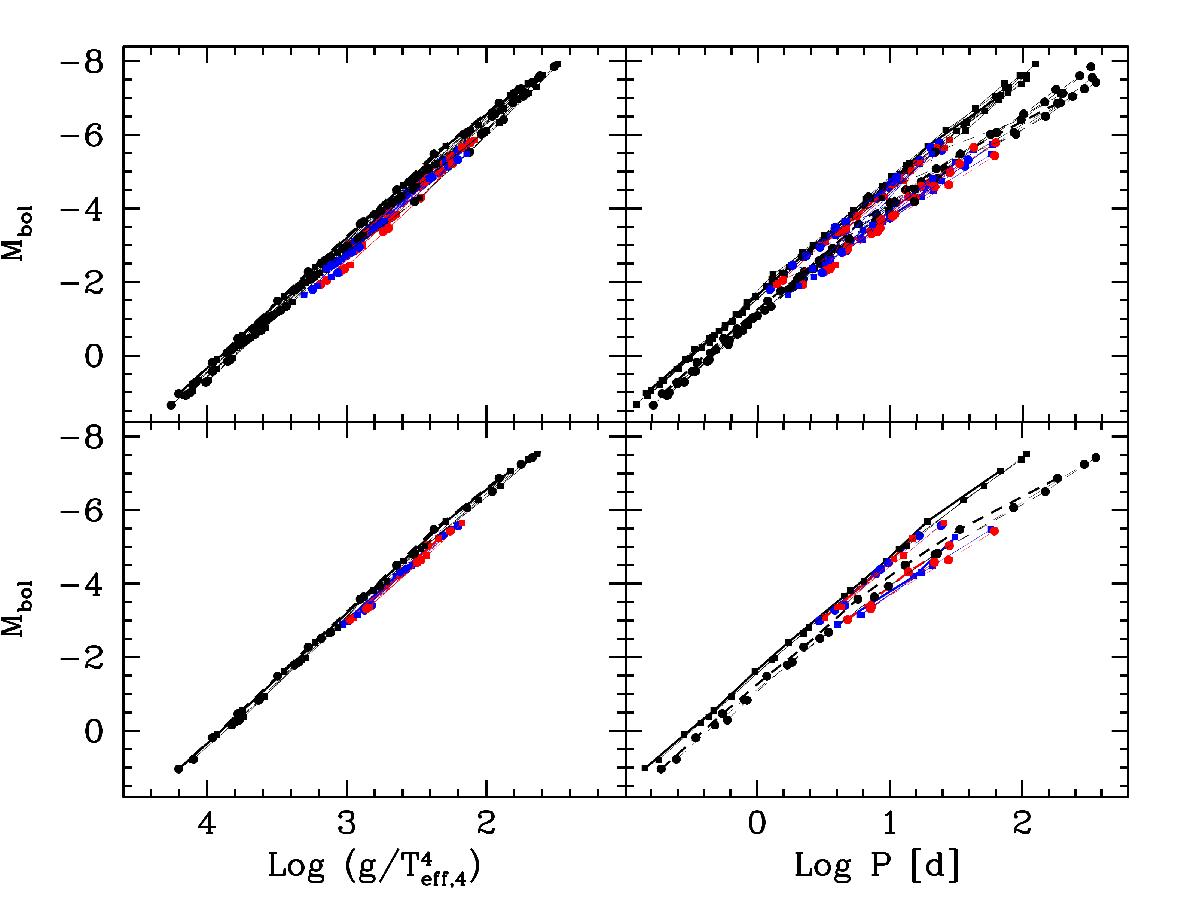
Comparison between the FWGLR (left panels) and the PLR (right panels). We show bolometric magnitudes of Cepheids of different initial masses as a function of ![]() (left panels) and as a function of the period (right panels). Differently colored lines correspond to first (black), second (blue), and third (red) crossings. The points along the lines correspond to the position of various initial mass stellar models (increasing from left to right). The filled squares correspond to the entry point in the IS and the filled disks to the exit point. The upper panels show the situation when all the stellar models for different initial masses, metallicities and rotations are plotted, that means all the models shown in Tables A.1 to A.3. The lower panels show only solar metallicity models.
(left panels) and as a function of the period (right panels). Differently colored lines correspond to first (black), second (blue), and third (red) crossings. The points along the lines correspond to the position of various initial mass stellar models (increasing from left to right). The filled squares correspond to the entry point in the IS and the filled disks to the exit point. The upper panels show the situation when all the stellar models for different initial masses, metallicities and rotations are plotted, that means all the models shown in Tables A.1 to A.3. The lower panels show only solar metallicity models.
Current usage metrics show cumulative count of Article Views (full-text article views including HTML views, PDF and ePub downloads, according to the available data) and Abstracts Views on Vision4Press platform.
Data correspond to usage on the plateform after 2015. The current usage metrics is available 48-96 hours after online publication and is updated daily on week days.
Initial download of the metrics may take a while.


