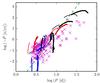
Fig. 13
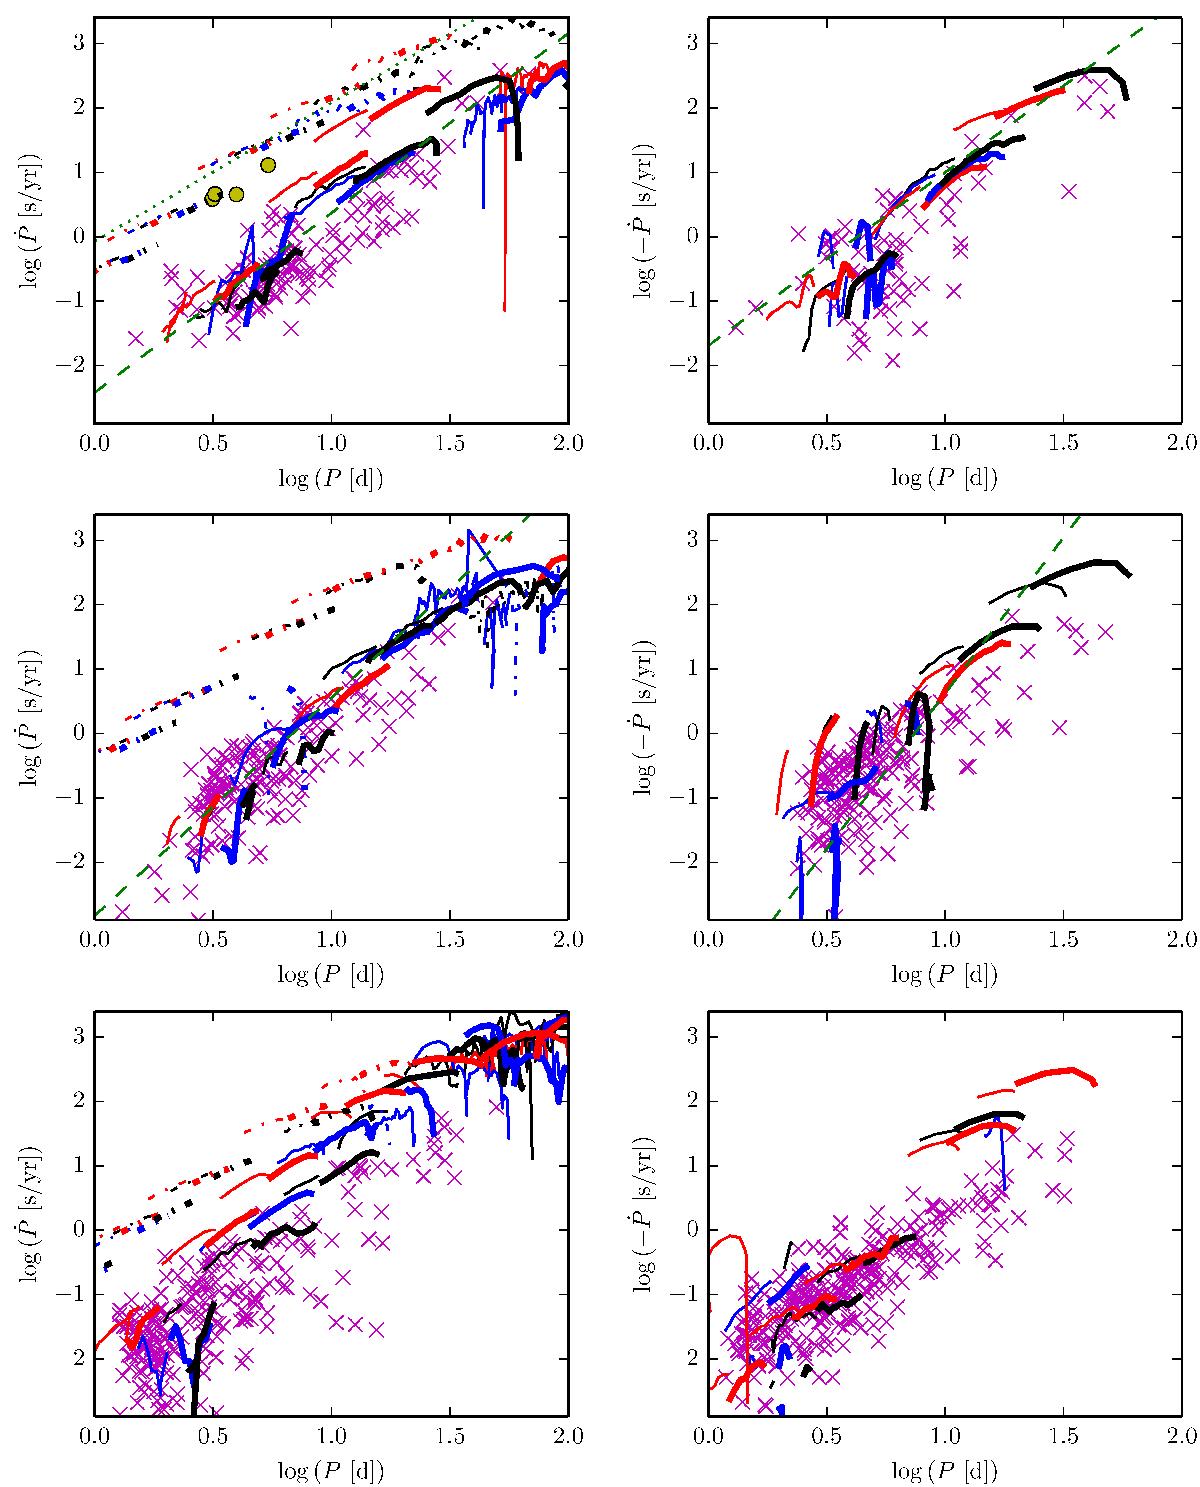
Comparison between predicted and empirical rates of period change, Ṗ. Fundamental mode models are shown as thicker lines, first overtones as thinner lines. Initial rotation velocity is color coded: non-rotating models are red, average rotation black, fast rotation blue. Left hand panels show increasing periods (first, dashed-dotted lines, and third crossings, solid lines), right hand panels decreasing periods (second crossings). Metallicity decreases from top to bottom: Z = 0.014 and data for Galactic Cepheids (Turner et al. 2006) with first crossing candidates Polaris, BY Cas, DX Gem, and HD 344787 highlighted as yellow filled circles (Turner et al. 2013); Z = 0.006 and data from LMC Cepheids by Pietrukowicz (2001); Z = 0.002 and data from SMC Cepheids by Pietrukowicz (2002). Theoretical Ṗ−P relations by Fadeyev (2014) and Fadeyev (2013) are shown as green dotted lines for 1st crossings and green dashed lines for 3rd crossings, where available.
Current usage metrics show cumulative count of Article Views (full-text article views including HTML views, PDF and ePub downloads, according to the available data) and Abstracts Views on Vision4Press platform.
Data correspond to usage on the plateform after 2015. The current usage metrics is available 48-96 hours after online publication and is updated daily on week days.
Initial download of the metrics may take a while.