Fig. 10
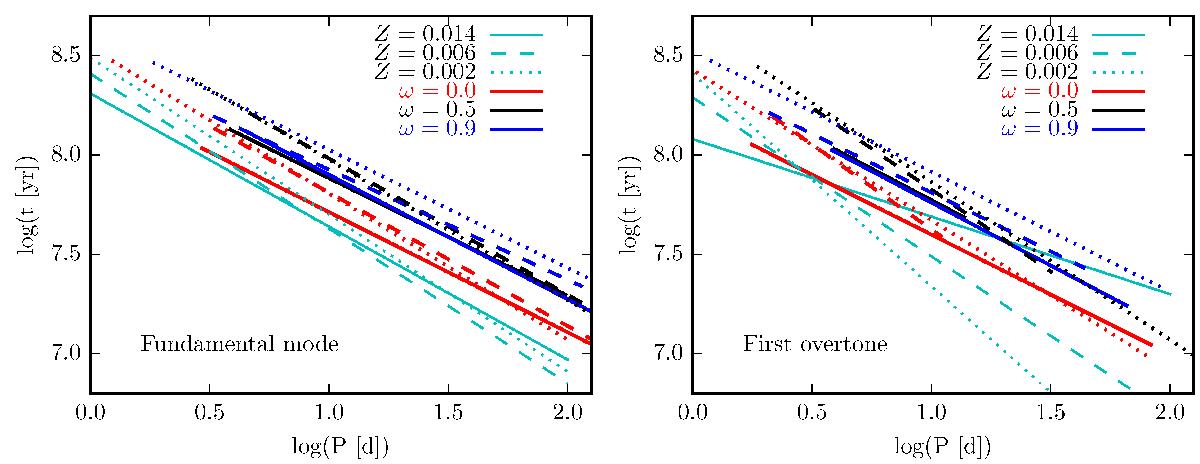
Period age relations as function of different initial rotation rate and metallicity, averaged over 2nd and 3rd crossing and the width of the instability strip. The cyan lines show PA-relations from Bono et al. (2005) for similar metallicities (Z = 0.02,0.01,0.004) plotted for a fixed log P range. Our models are shown only for the period-range accessible from the computed models. Non-rotating models are shown in red, average rotation in black, and fast in blue.
Current usage metrics show cumulative count of Article Views (full-text article views including HTML views, PDF and ePub downloads, according to the available data) and Abstracts Views on Vision4Press platform.
Data correspond to usage on the plateform after 2015. The current usage metrics is available 48-96 hours after online publication and is updated daily on week days.
Initial download of the metrics may take a while.