Fig. 1
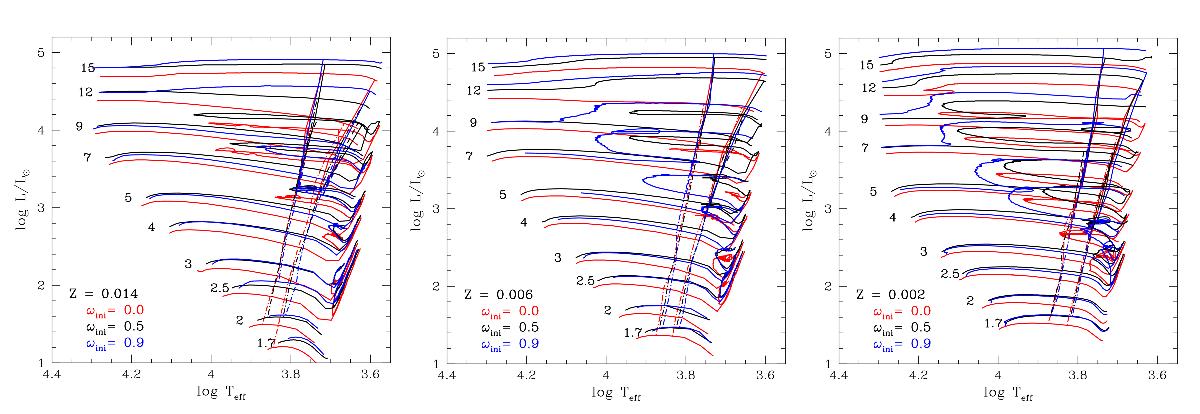
Post-MS evolutionary tracks used in this work (Georgy et al. 2013), with overplotted IS boundaries of radial fundamental pulsation determined for the different assumed initial rotation rates. The number at the beginning of each track indicates initial mass in solar units. Assumed initial rotation rates are color-coded; red lines are for models without rotation (ωini = 0), black lines for models with an initial rotation of 50% critical rate (ωini = 0.5), and blue lines for an initial rotation of 90% critical rate. IS boundaries shown as dash-dotted lines indicate first crossing models, dashed lines the second crossing, and solid lines the third crossing.
Current usage metrics show cumulative count of Article Views (full-text article views including HTML views, PDF and ePub downloads, according to the available data) and Abstracts Views on Vision4Press platform.
Data correspond to usage on the plateform after 2015. The current usage metrics is available 48-96 hours after online publication and is updated daily on week days.
Initial download of the metrics may take a while.