Fig. 8
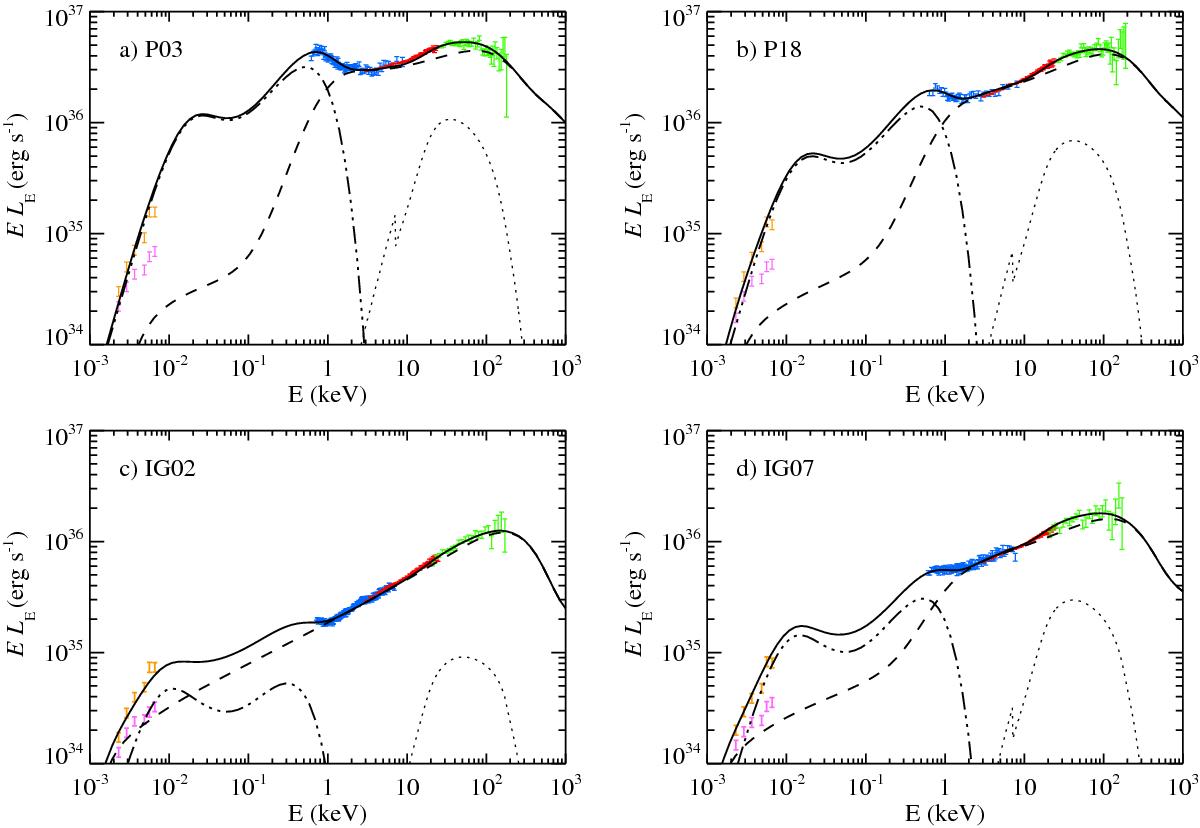
Spectra obtained from self-consistent simulations for epochs P03 a); P18 b); IG02 c); and IG07 d). The X-ray data from Swift/XRT, RXTE/PCA, and RXTE/HEXTE (panels a) and b)) or INTEGRAL/ISGRI (panels c) and d)) are shown with blue, red, and green symbols, respectively. Swift/UVOT data, corrected for interstellar reddening, are plotted with magenta symbols for E(B−V) = 0.34 and with yellow symbols for E(B−V) = 0.45. The solid black line is the spectrum obtained from self-consistent simulations and it consists of three major components: (1) the emission from the hot medium produced by synchrotron radiation and Comptonization of disk and synchrotron seed photons with an additional contribution from bremsstrahlung emission (dashed lines); (2) the contribution of irradiated accretion disk (dot-dashed lines); and (3) the Compton reflection hump taken from the best fitting sc compps model fit (dotted lines).
Current usage metrics show cumulative count of Article Views (full-text article views including HTML views, PDF and ePub downloads, according to the available data) and Abstracts Views on Vision4Press platform.
Data correspond to usage on the plateform after 2015. The current usage metrics is available 48-96 hours after online publication and is updated daily on week days.
Initial download of the metrics may take a while.