Fig. 6
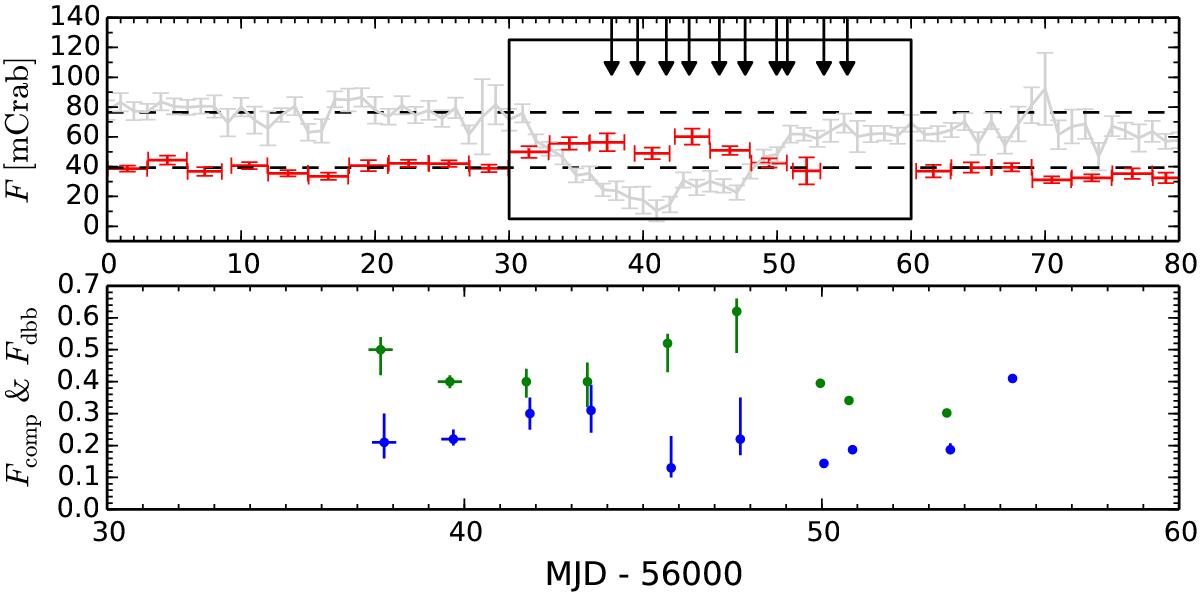
Light curves of the 2012 soft state transition (see also Yoshikawa et al. 2015). Top panel: 15–50 keV Swift/BAT (light gray) and 2–4 keV MAXI/GSC (red) light curves anti-correlate, indicative of spectral softening as seen by INTEGRAL/ISGRI in the 2011 hard X-ray dip. The arrows indicate the times of the Swift/XRT observations. Bottom panel: evolution of the disk (green) and Comptonized fluxes (blue) from Swift/XRT compps fits. We note how, for the only time during the ten-year outburst of Swift J1753.5–0127, the diskbb component emits most of the radiative flux.
Current usage metrics show cumulative count of Article Views (full-text article views including HTML views, PDF and ePub downloads, according to the available data) and Abstracts Views on Vision4Press platform.
Data correspond to usage on the plateform after 2015. The current usage metrics is available 48-96 hours after online publication and is updated daily on week days.
Initial download of the metrics may take a while.