Fig. 5
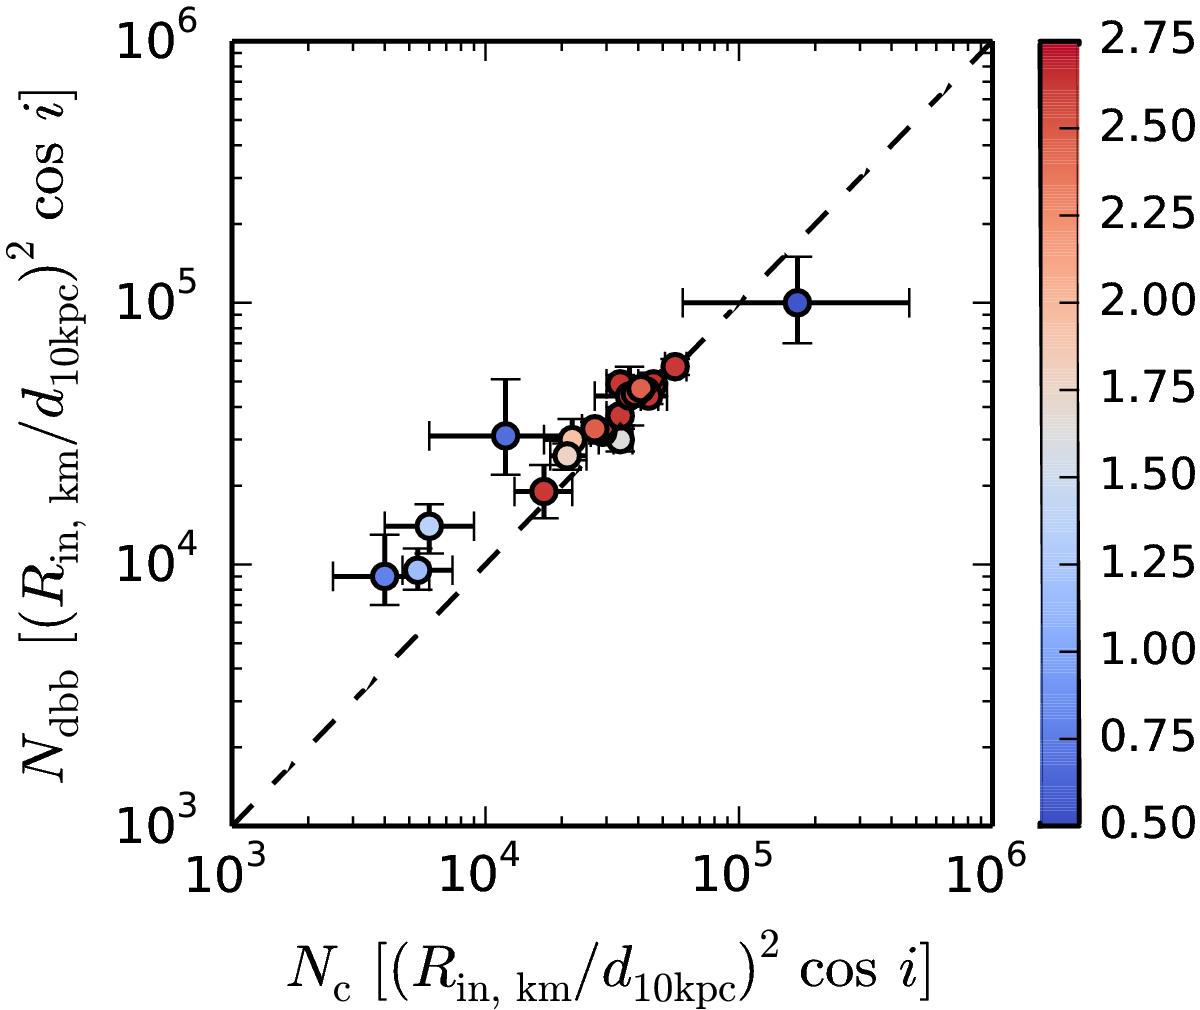
Relation between diskbb model normalization and the compps model normalization (color-coding as in Fig. 2). The dashed line shows a linear, one-to-one trend that may be a sign that about half of the disk photons enter the hot flow (or the corona above the accretion disk). The trend seems to disappear when the flux drops below the critical limit.
Current usage metrics show cumulative count of Article Views (full-text article views including HTML views, PDF and ePub downloads, according to the available data) and Abstracts Views on Vision4Press platform.
Data correspond to usage on the plateform after 2015. The current usage metrics is available 48-96 hours after online publication and is updated daily on week days.
Initial download of the metrics may take a while.