Fig. 3
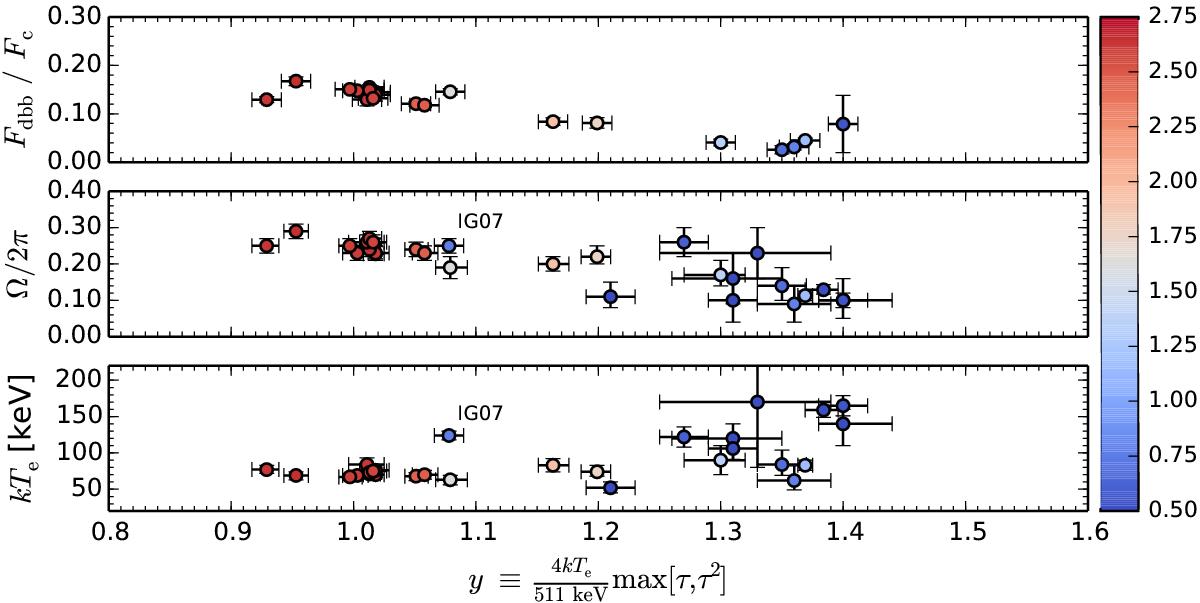
Evolution of spectral parameters as a function of the Compton parameter y from the compps fits (color-coding as in Fig. 2). The overall trends of Ldbb/Lc ratio (top panel) and the reflection amplitude Ω/2π (middle panel) show qualitatively similar behavior to the nthcomp fits. We also see how the electron temperature kTe (bottom panel) increases when the flux drops below the critical limit of Fx ≲ 10-8 erg cm-2 s-1. The kTe increase may be caused by the change of geometry and seed photon source: disk truncation leads to fewer disk photons entering the Comptonized region, resulting in less efficient cooling of the electrons and thus higher equilibrium temperatures.
Current usage metrics show cumulative count of Article Views (full-text article views including HTML views, PDF and ePub downloads, according to the available data) and Abstracts Views on Vision4Press platform.
Data correspond to usage on the plateform after 2015. The current usage metrics is available 48-96 hours after online publication and is updated daily on week days.
Initial download of the metrics may take a while.