Fig. 2
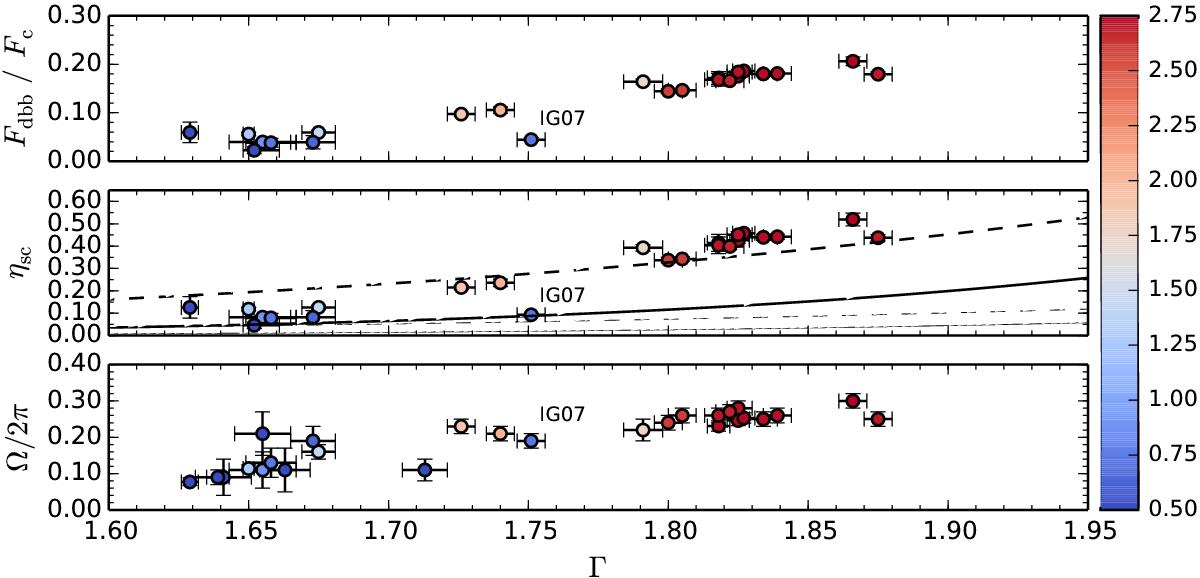
Evolution of spectral parameters as a function of the photon index Γ from the nthcomp fits. Color-coding indicates the estimated bolometric flux in units of 10-8 erg cm-2 s-1. The top panel shows the ratio Fdbb/Fc and the middle panel shows the ratio Fseed/Fcor, which is connected to the photon index Γ of Comptonization power law according to Eq. (1). The data are consistent with the δ = 1/6 trend line (dashed lines) when the flux is above a critical limit Fx ≳ 10-8 erg cm-2 s-1 and the spectra is softer than Γ ≳ 1.8. When the flux drops below this limit (Fx ≲ 10-8 erg cm-2 s-1) and the spectrum hardens to Γ ≲ 1.7, the data are instead consistent with the δ = 1/10 track (solid lines). Thick lines correspond to the assumption i = 40° and thin lines correspond to i = 80°. This behavior suggests that during the initial outburst peak the seed photons for Comptonization come predominantly from the accretion disk, whereas below the critical limit – when the accretion disk has receded further from the BH – the seed photon come predominantly from synchrotron emission from the inner hot flow. The bottom panel shows that the reflection amplitude Ω/2π decreases during the flux decay, indicating that the reflector (i.e., the cold accretion disk) truncates farther from the BH as the outburst progresses.
Current usage metrics show cumulative count of Article Views (full-text article views including HTML views, PDF and ePub downloads, according to the available data) and Abstracts Views on Vision4Press platform.
Data correspond to usage on the plateform after 2015. The current usage metrics is available 48-96 hours after online publication and is updated daily on week days.
Initial download of the metrics may take a while.