Fig. 1
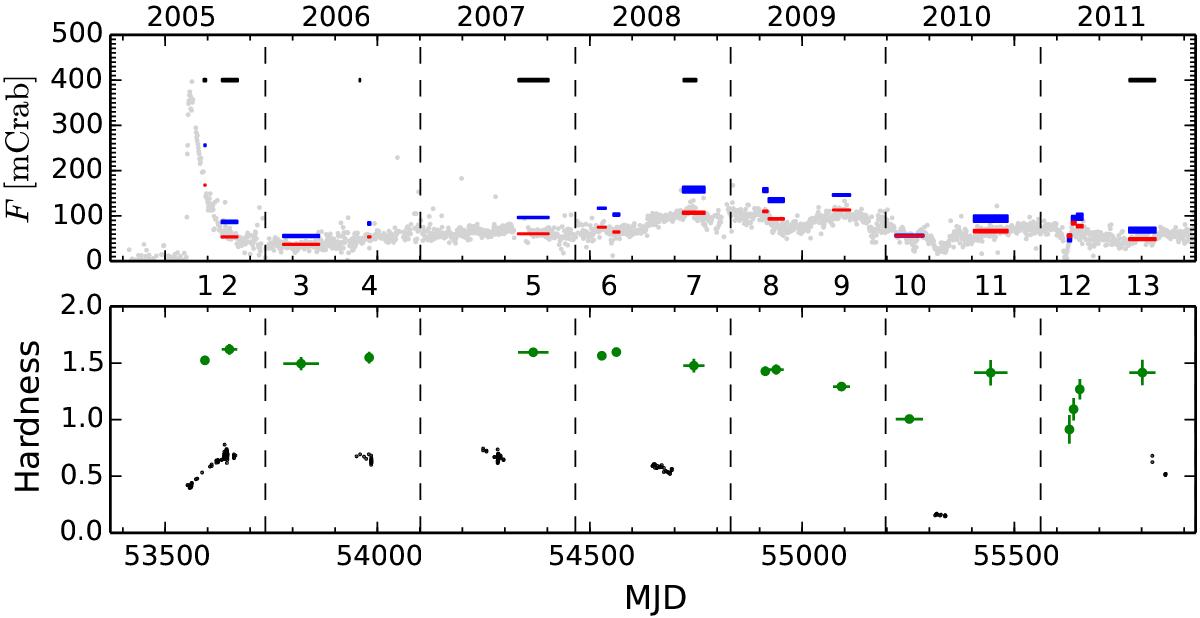
Light curve of the outburst. Top panel: light gray dots show the 15–50 keV Swift/BAT light curve. The red and blue stripes show the visibility season averaged INTEGRAL/IBIS/ISGRI fluxes for the groups 1–13 in the 20–60 keV and 60–200 keV bands, respectively. The horizontal width of the stripes indicate the time interval over which the observations were made, and the vertical width indicate the measured flux error. The black stripes only indicate the time ranges where PCA spectra were accumulated. The bottom panel shows the hardness ratios between the two INTEGRAL bands (green symbols) as well as the Swift/XRT hardness ratios between the 2−10 keV and 0.3−2 keV bands (black symbols).
Current usage metrics show cumulative count of Article Views (full-text article views including HTML views, PDF and ePub downloads, according to the available data) and Abstracts Views on Vision4Press platform.
Data correspond to usage on the plateform after 2015. The current usage metrics is available 48-96 hours after online publication and is updated daily on week days.
Initial download of the metrics may take a while.