Fig. 9
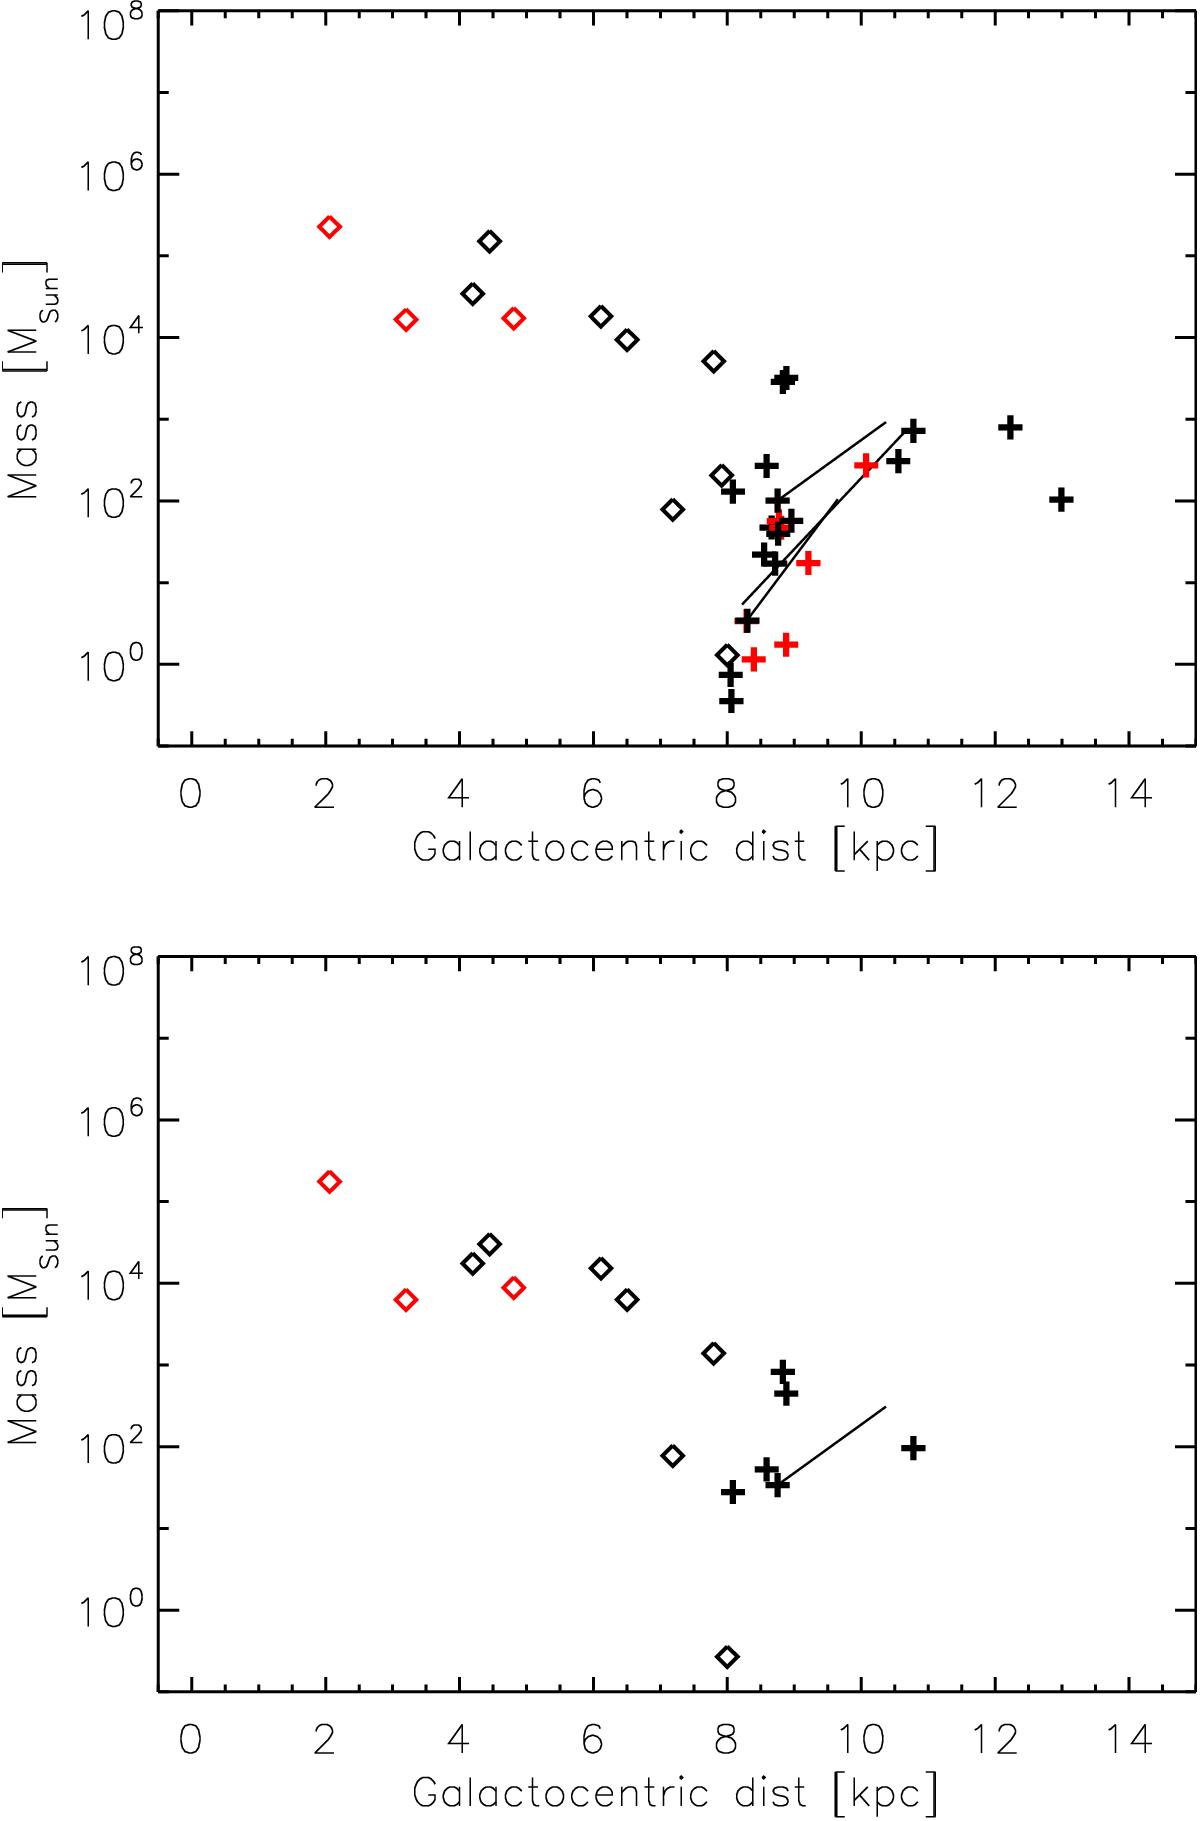
Mass as a function of Galactocentric distance for the ECC Hi-GAL objects. Red and black symbols indicate the clumps from Category I and II, respectively. Plus signs indicate the clumps in the outer part of the Galaxy and diamonds indicate the sources in the inner Galaxy. Solid lines show the ranges of masses and Galactocentric distances for sources with large distance discrepancies. Top: calculated mass above 3 × 1021 cm-2. Bottom: mass of the high column density gas, N(H2) > 1022 cm-2.
Current usage metrics show cumulative count of Article Views (full-text article views including HTML views, PDF and ePub downloads, according to the available data) and Abstracts Views on Vision4Press platform.
Data correspond to usage on the plateform after 2015. The current usage metrics is available 48-96 hours after online publication and is updated daily on week days.
Initial download of the metrics may take a while.