Fig. 7
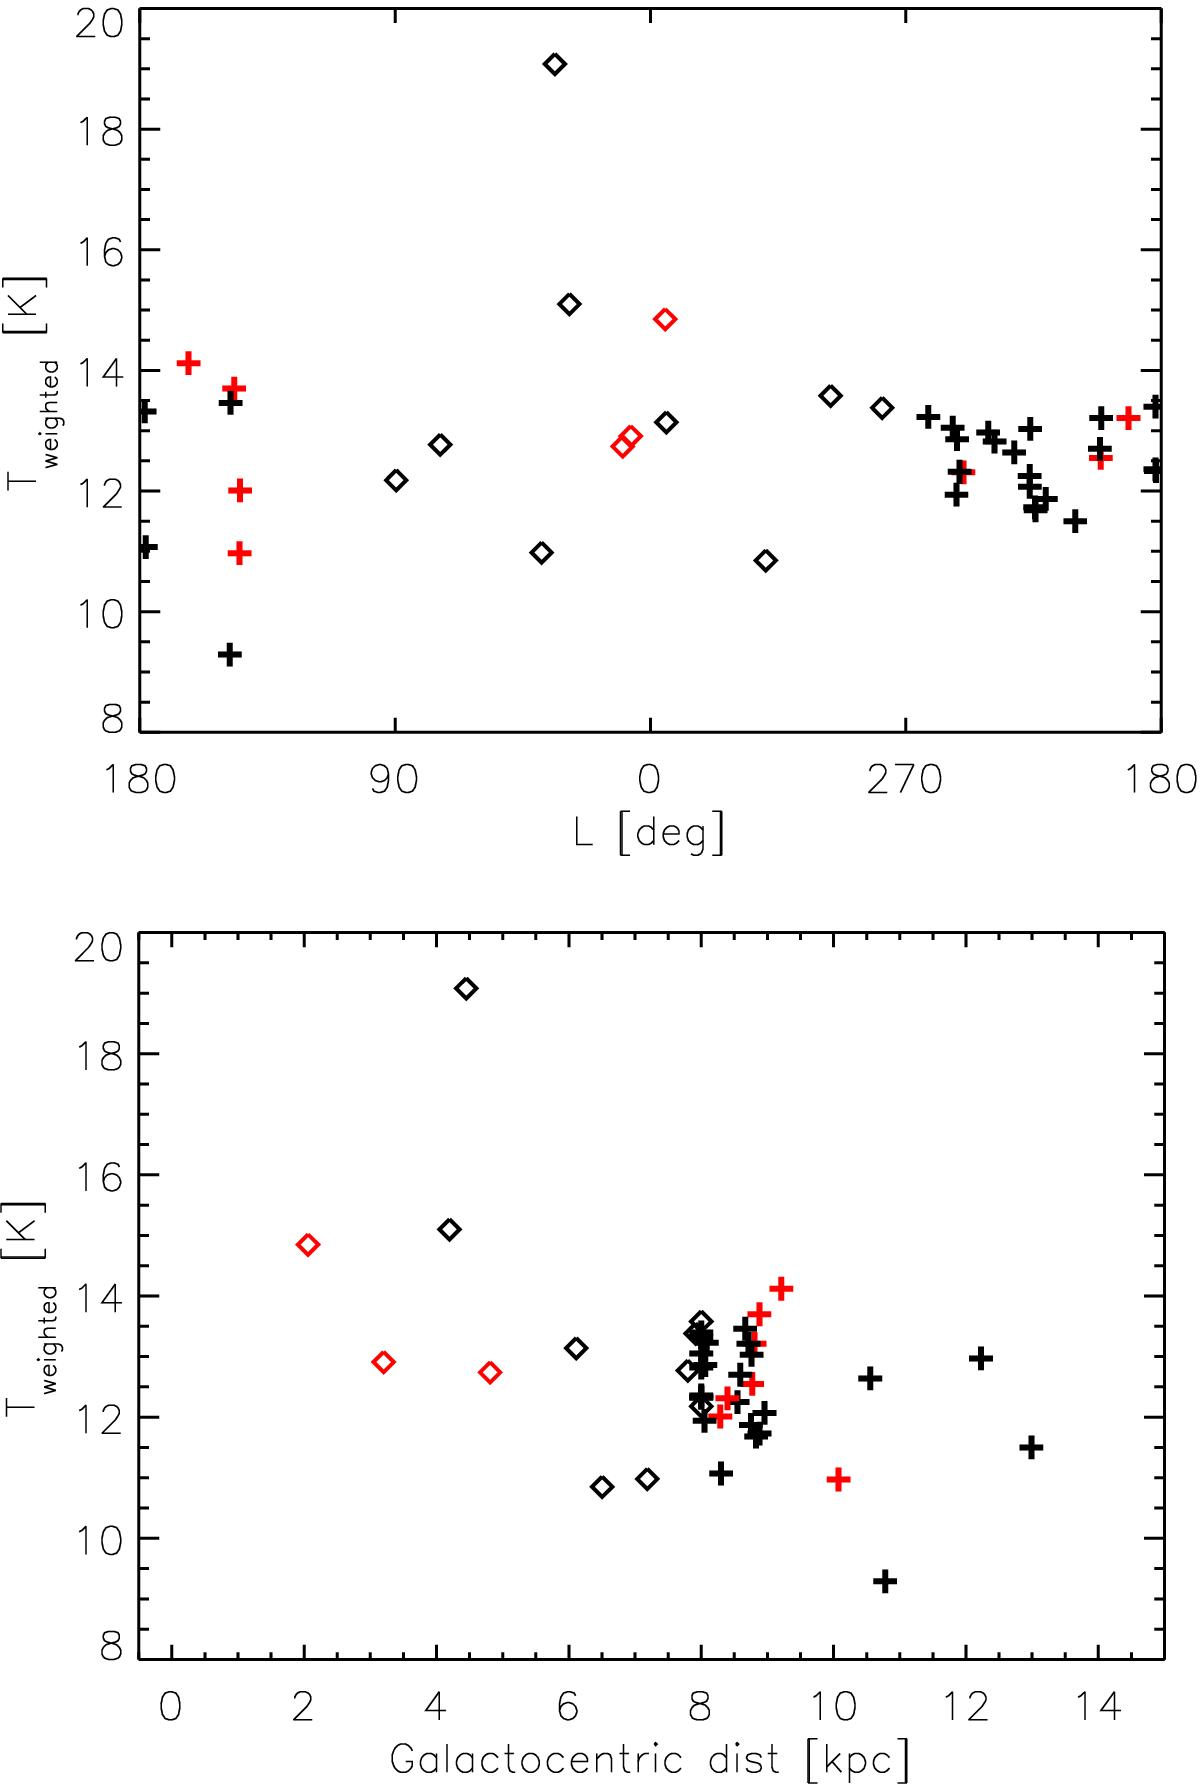
Column density weighted average temperature distribution of the ECC clumps as a function of Galactic longitude for the 43 objects (top, four sources in the Galactic center region and a low column density source are excluded; see details in Sect. 3.3) and as a function of Galactocentric distance for the 35 clumps with available distance and average temperature estimates (bottom). Red symbols indicate the clumps without 70 μm point sources.
Current usage metrics show cumulative count of Article Views (full-text article views including HTML views, PDF and ePub downloads, according to the available data) and Abstracts Views on Vision4Press platform.
Data correspond to usage on the plateform after 2015. The current usage metrics is available 48-96 hours after online publication and is updated daily on week days.
Initial download of the metrics may take a while.