Free Access
Fig. 6
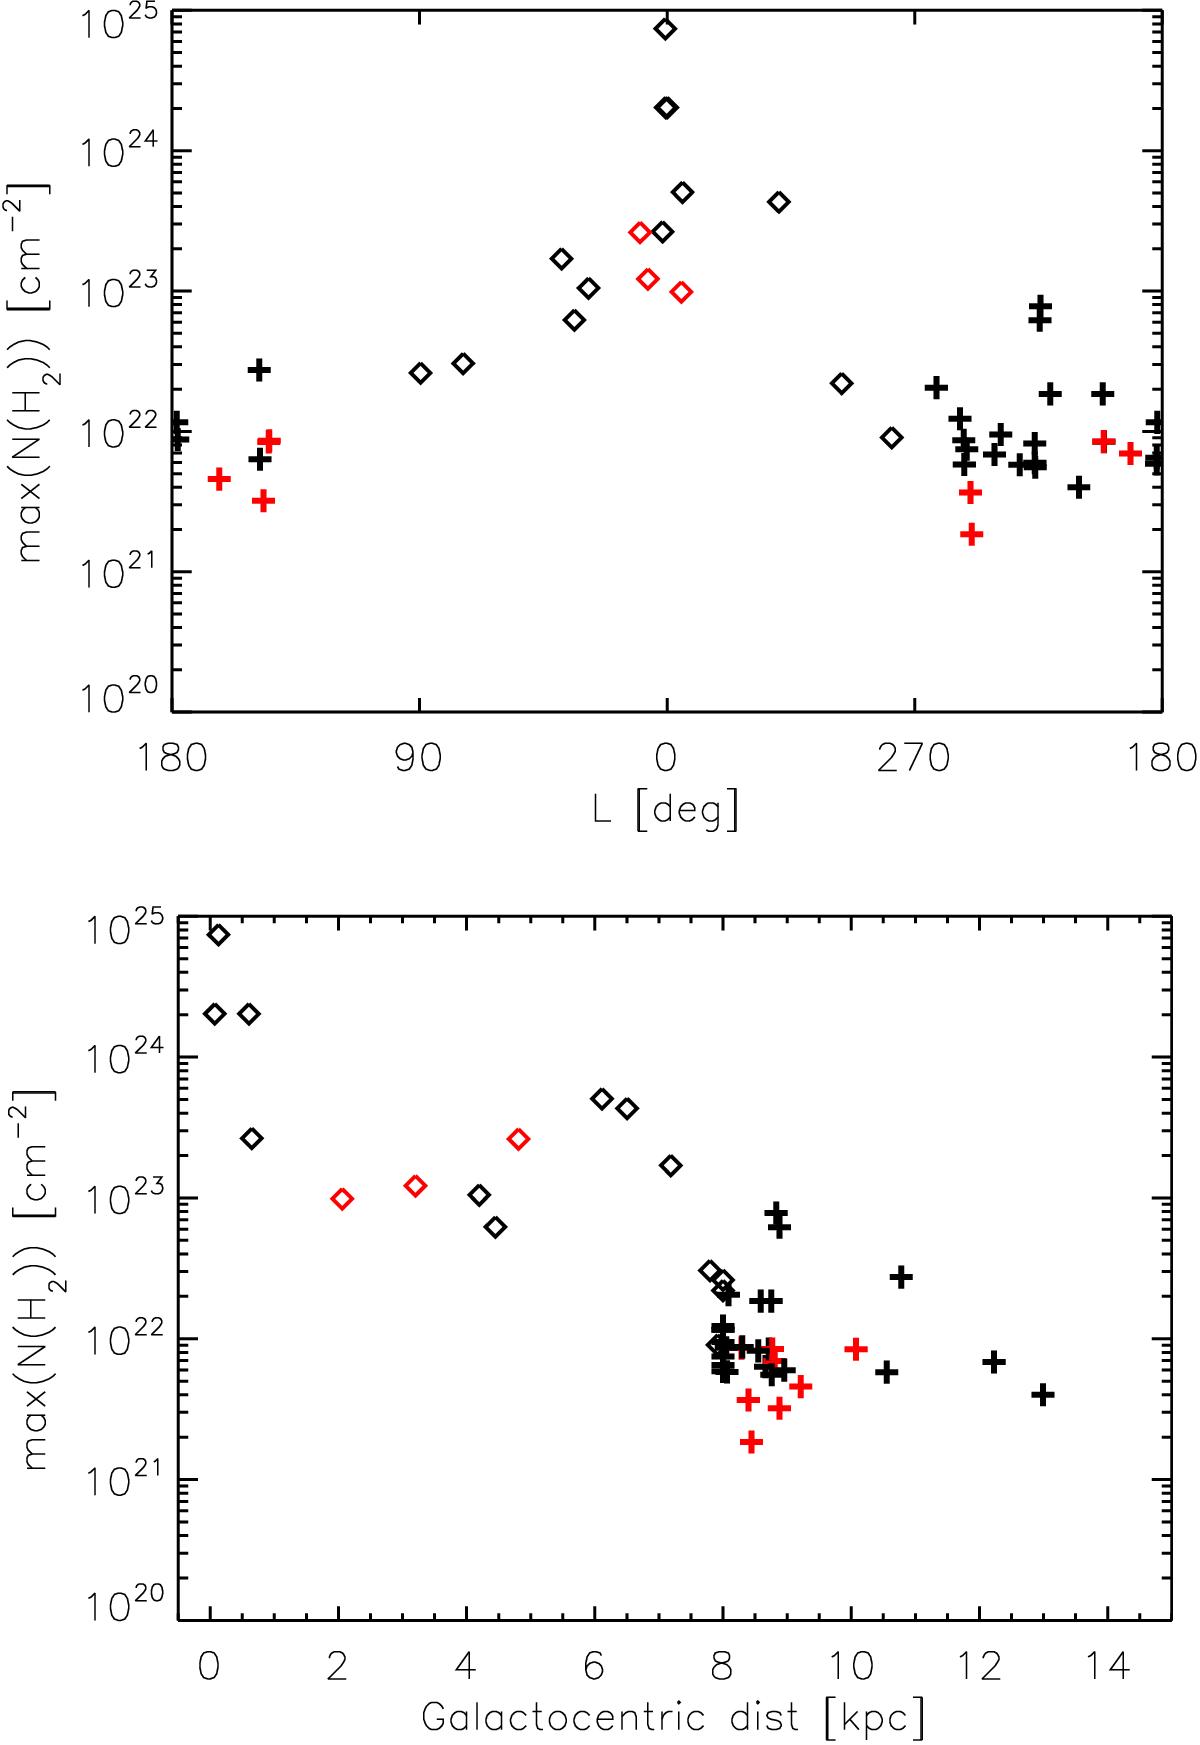
Peak H2 column density distribution of the ECC clumps as a function of Galatic longitude for the 48 objects (top) and Galactocentric distance for the 40 clumps with available distance estimates (bottom). Red symbols indicate the clumps without 70 μm point sources.
This figure is made of several images, please see below:
Current usage metrics show cumulative count of Article Views (full-text article views including HTML views, PDF and ePub downloads, according to the available data) and Abstracts Views on Vision4Press platform.
Data correspond to usage on the plateform after 2015. The current usage metrics is available 48-96 hours after online publication and is updated daily on week days.
Initial download of the metrics may take a while.