Fig. 5
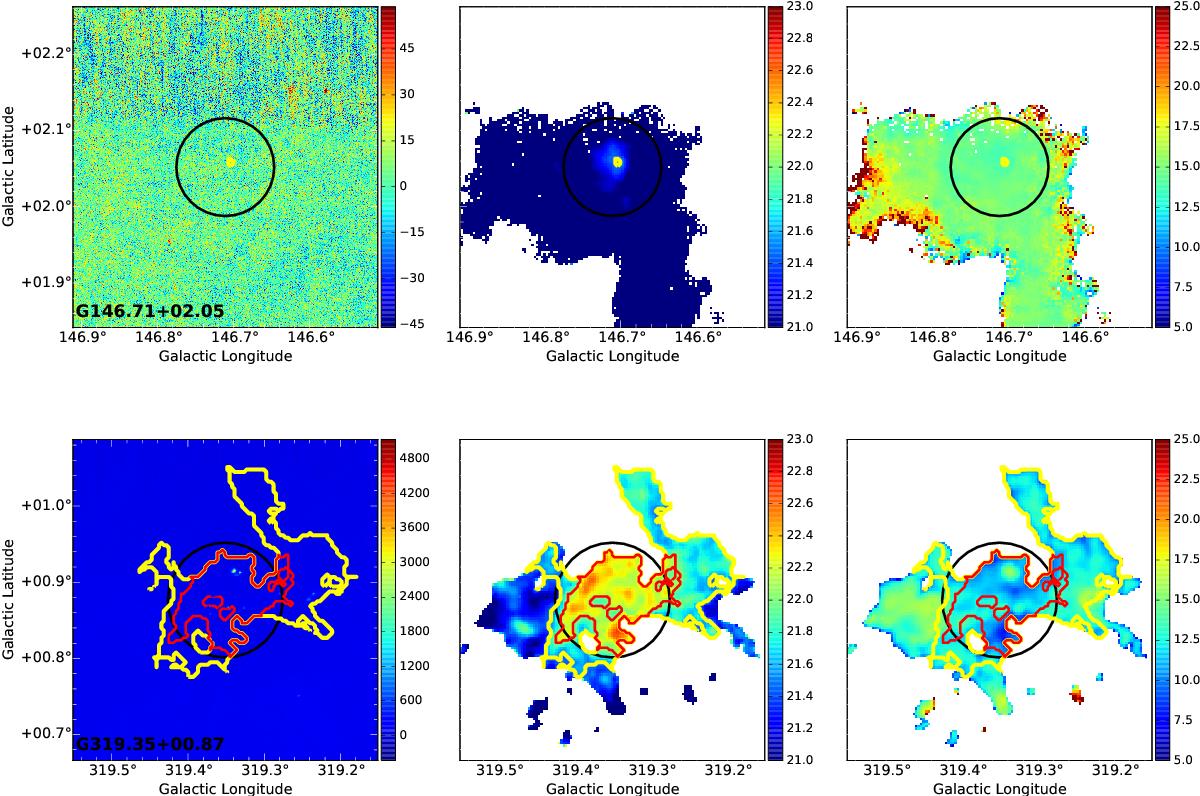
70 μm images ([MJy/sr], left) and calculated column density ([cm-2], middle) in logarithmic scale and dust temperature ([K], right) maps for the same clumps shown in Fig. 4, ECC G146.71+02.05 (top) and G319.35+0.87 (bottom), from Category I and II with a resolution of 36′′. Yellow and red contour levels refer to the H2 column density thresholds 3 × 10²¹ and 1022 cm-2, respectively. Black circles are centered at the position of the Planck clump and circle sizes correspond to the major axis given in the ECC catalog.
Current usage metrics show cumulative count of Article Views (full-text article views including HTML views, PDF and ePub downloads, according to the available data) and Abstracts Views on Vision4Press platform.
Data correspond to usage on the plateform after 2015. The current usage metrics is available 48-96 hours after online publication and is updated daily on week days.
Initial download of the metrics may take a while.