Free Access
Fig. 3
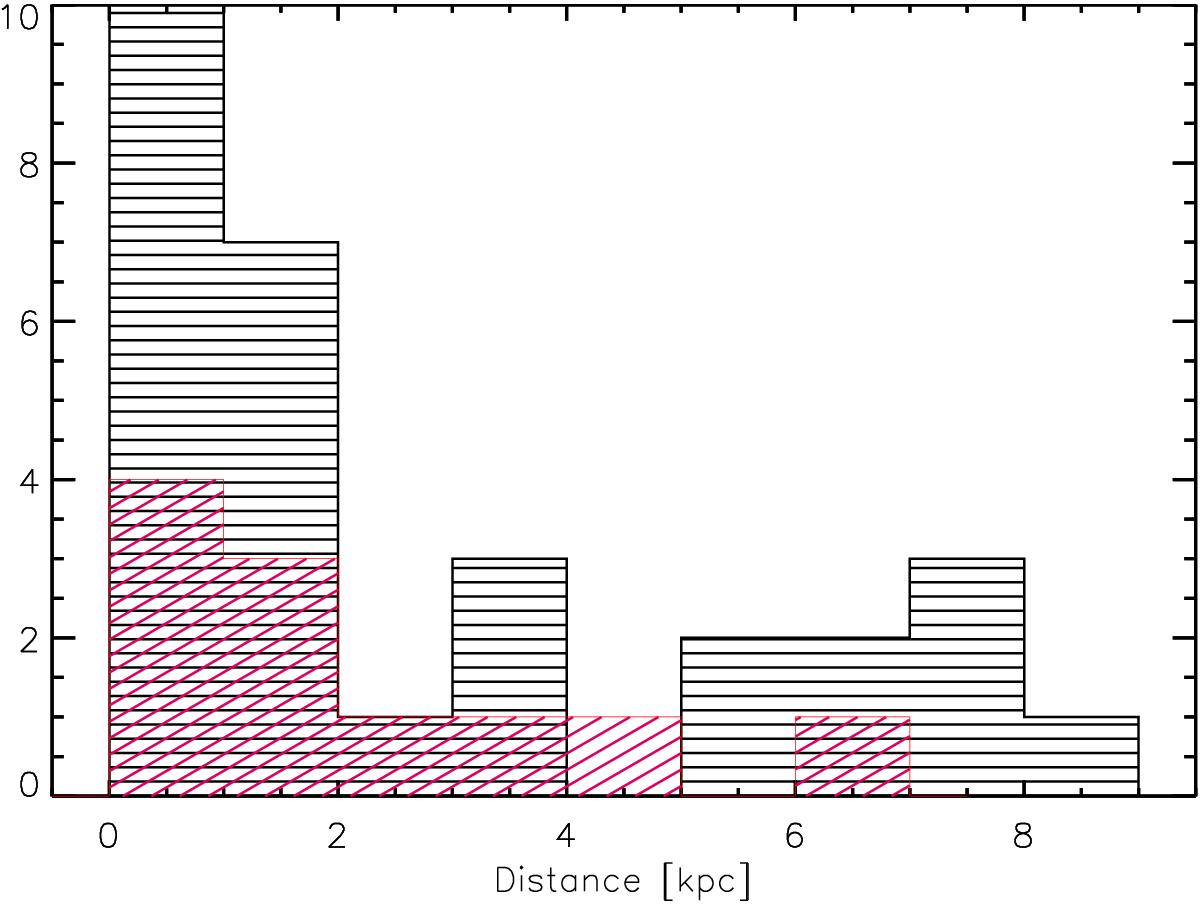
Distribution of the ECC clumps as a function of distance. Red and black histograms indicate the clumps from Category I (clumps without 70 μm sources) and Category II (clumps with 70 μm sources), respectively.
Current usage metrics show cumulative count of Article Views (full-text article views including HTML views, PDF and ePub downloads, according to the available data) and Abstracts Views on Vision4Press platform.
Data correspond to usage on the plateform after 2015. The current usage metrics is available 48-96 hours after online publication and is updated daily on week days.
Initial download of the metrics may take a while.