Fig. D.2
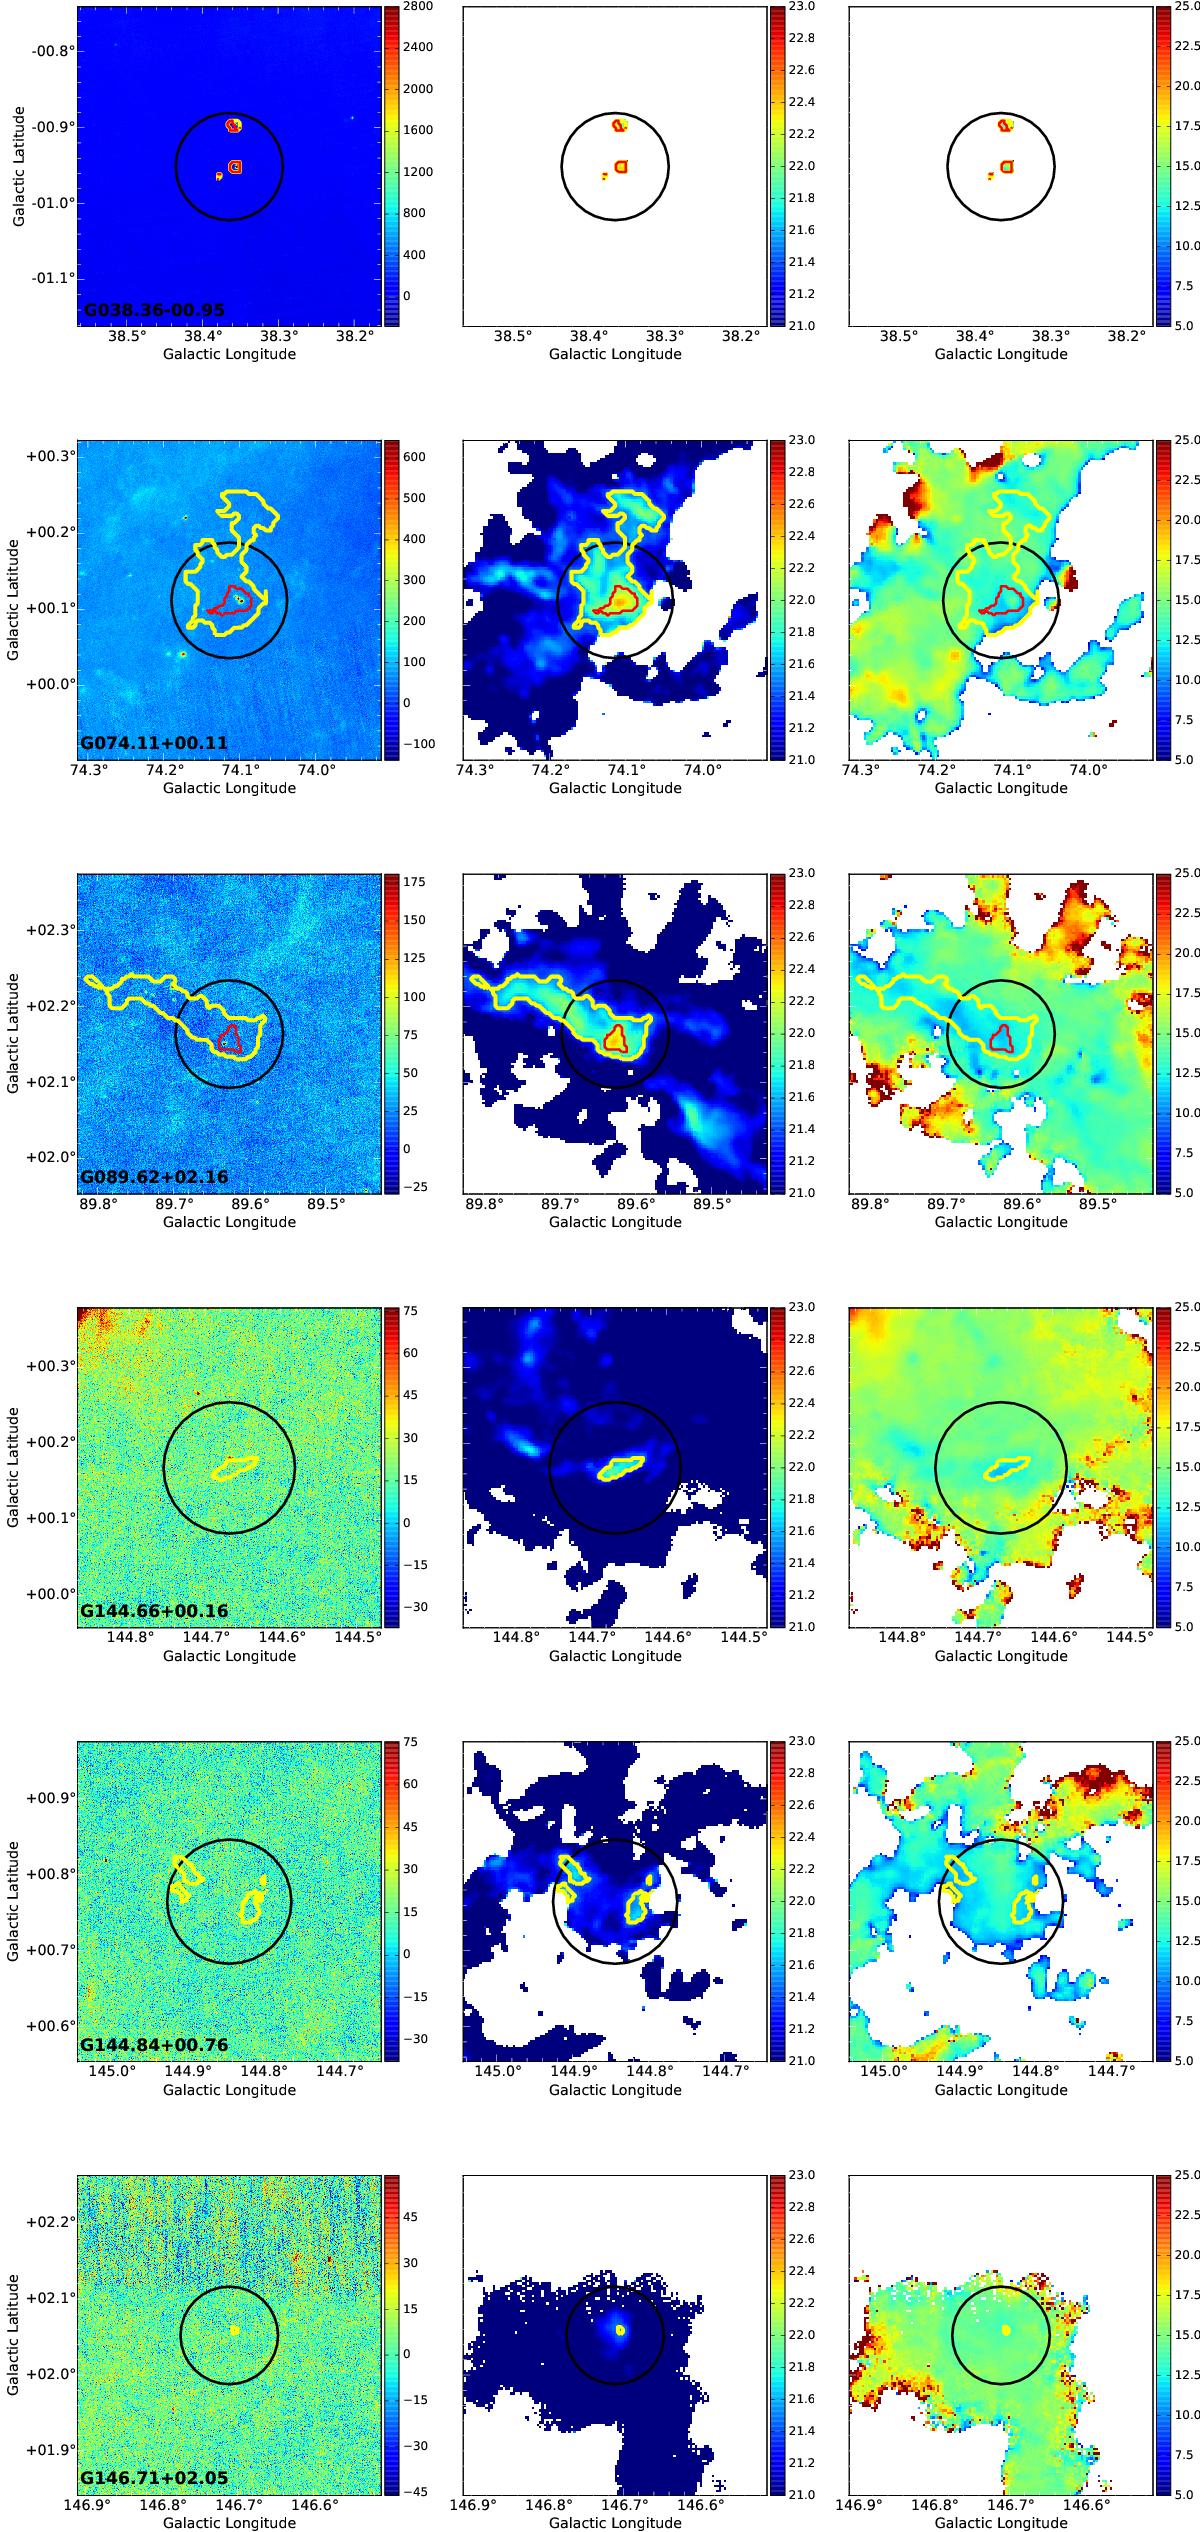
70 μm images ([MJy/sr], left) and calculated column density ([cm-2], middle) in logarithmic scale and dust temperature ([K], right) maps with a resolution of 36″. Yellow and red contour levels are at 3 × 1021 cm-2 and 1022 cm-2, respectively. Black circles are placed at the positions of the Planck clumps and their sizes correspond to the major axis of the clumps reported in the ECC catalog.
Current usage metrics show cumulative count of Article Views (full-text article views including HTML views, PDF and ePub downloads, according to the available data) and Abstracts Views on Vision4Press platform.
Data correspond to usage on the plateform after 2015. The current usage metrics is available 48-96 hours after online publication and is updated daily on week days.
Initial download of the metrics may take a while.