Fig. 11
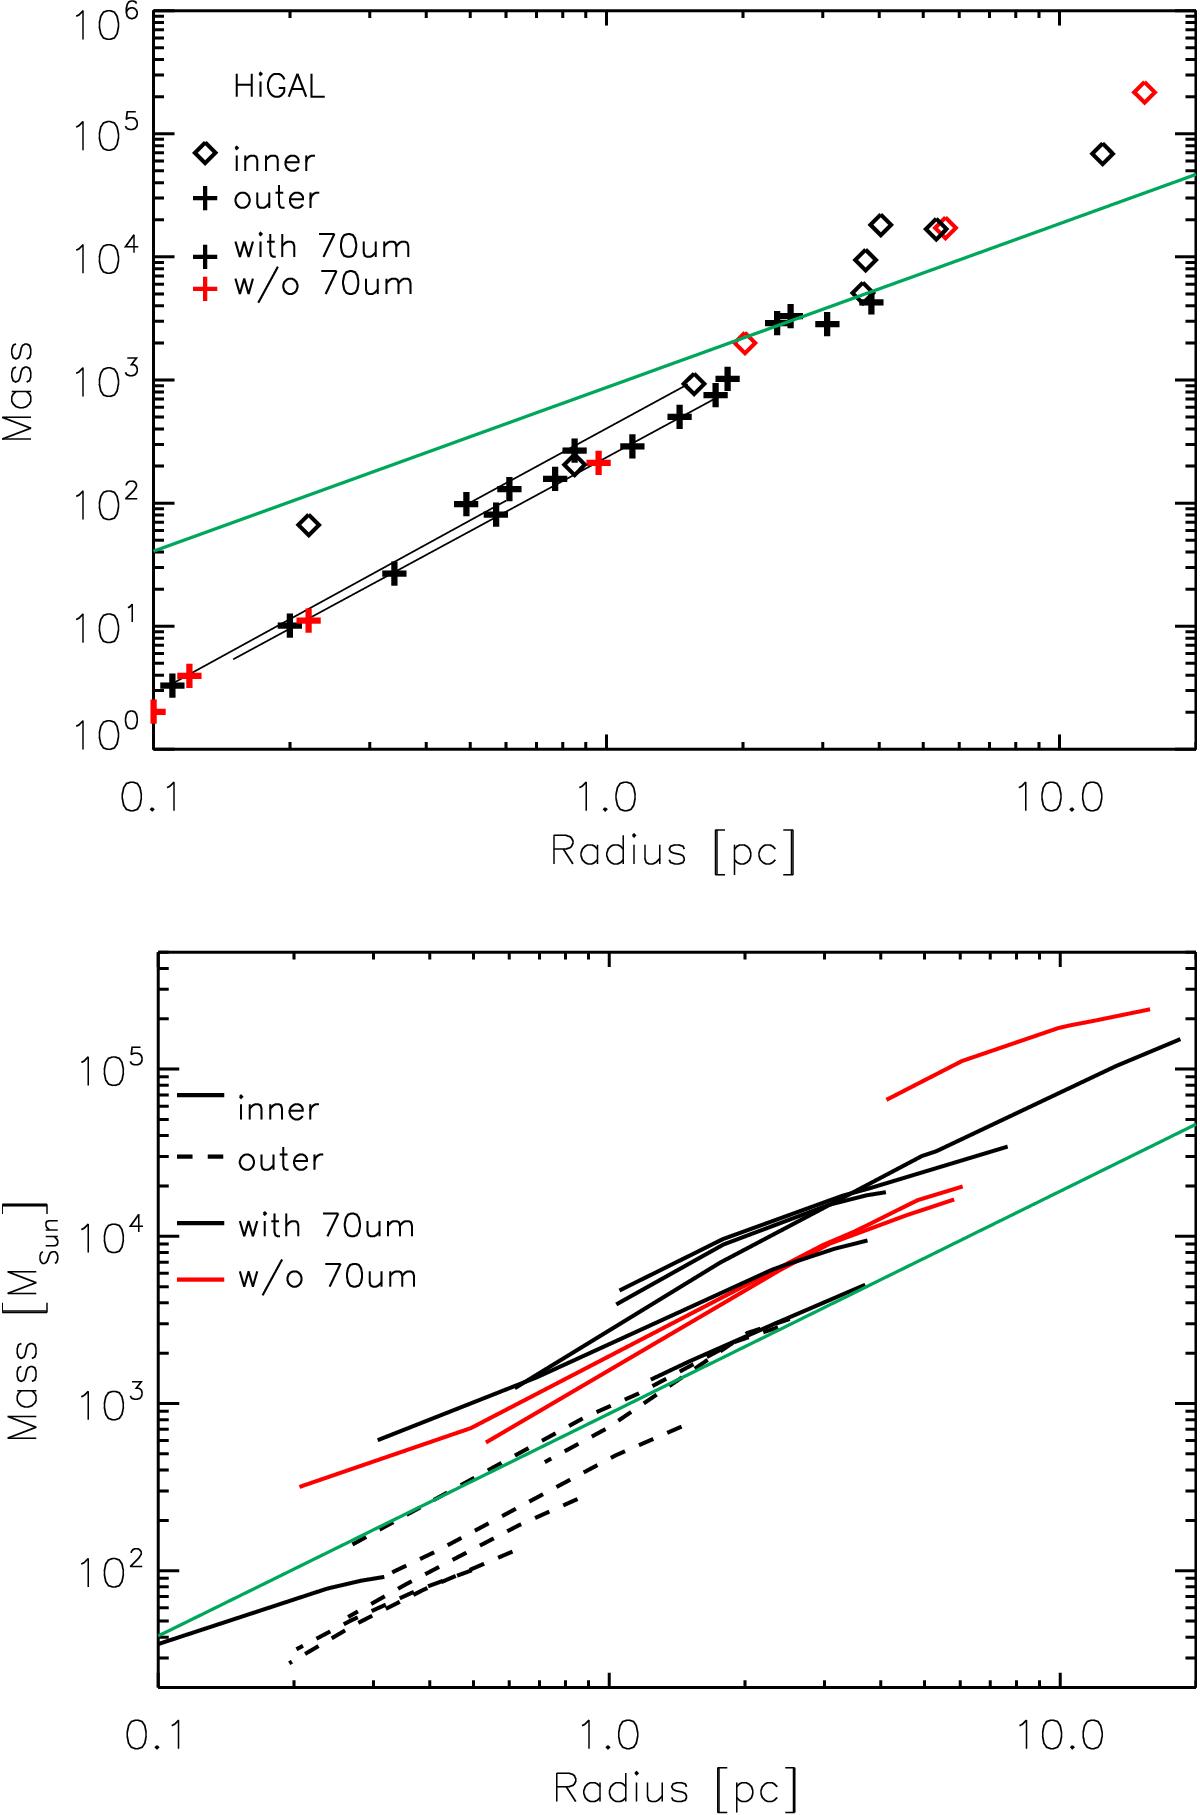
Top: mass-size diagram for the ECC Hi-GAL objects based on the Hi-GAL Herschel column density maps. Sources with available distance estimates are shown. Red and black symbols indicate the clumps from Category I and II, respectively. Plus signs indicate the clumps in the outer part of the Galaxy and diamonds indicate the sources in the inner Galaxy. Green line indicates the mass-size threshold for massive star formation: mlim = 870 M⊙(r/ pc)1.33 (Kauffmann & Pillai 2010). Solid lines show the ranges of masses and radii for sources with large distance discrepancies. Bottom: mass-size diagram based on the Hi-GAL column density maps. Masses and sizes are calculated within different column density limits; see details in text. Sources with peak column density values larger than 1022 cm-2 are shown. Dashed lines indicate the sources in the outer Galaxy. Red lines indicate the sources without 70 μm point sources.
Current usage metrics show cumulative count of Article Views (full-text article views including HTML views, PDF and ePub downloads, according to the available data) and Abstracts Views on Vision4Press platform.
Data correspond to usage on the plateform after 2015. The current usage metrics is available 48-96 hours after online publication and is updated daily on week days.
Initial download of the metrics may take a while.