Fig. 10
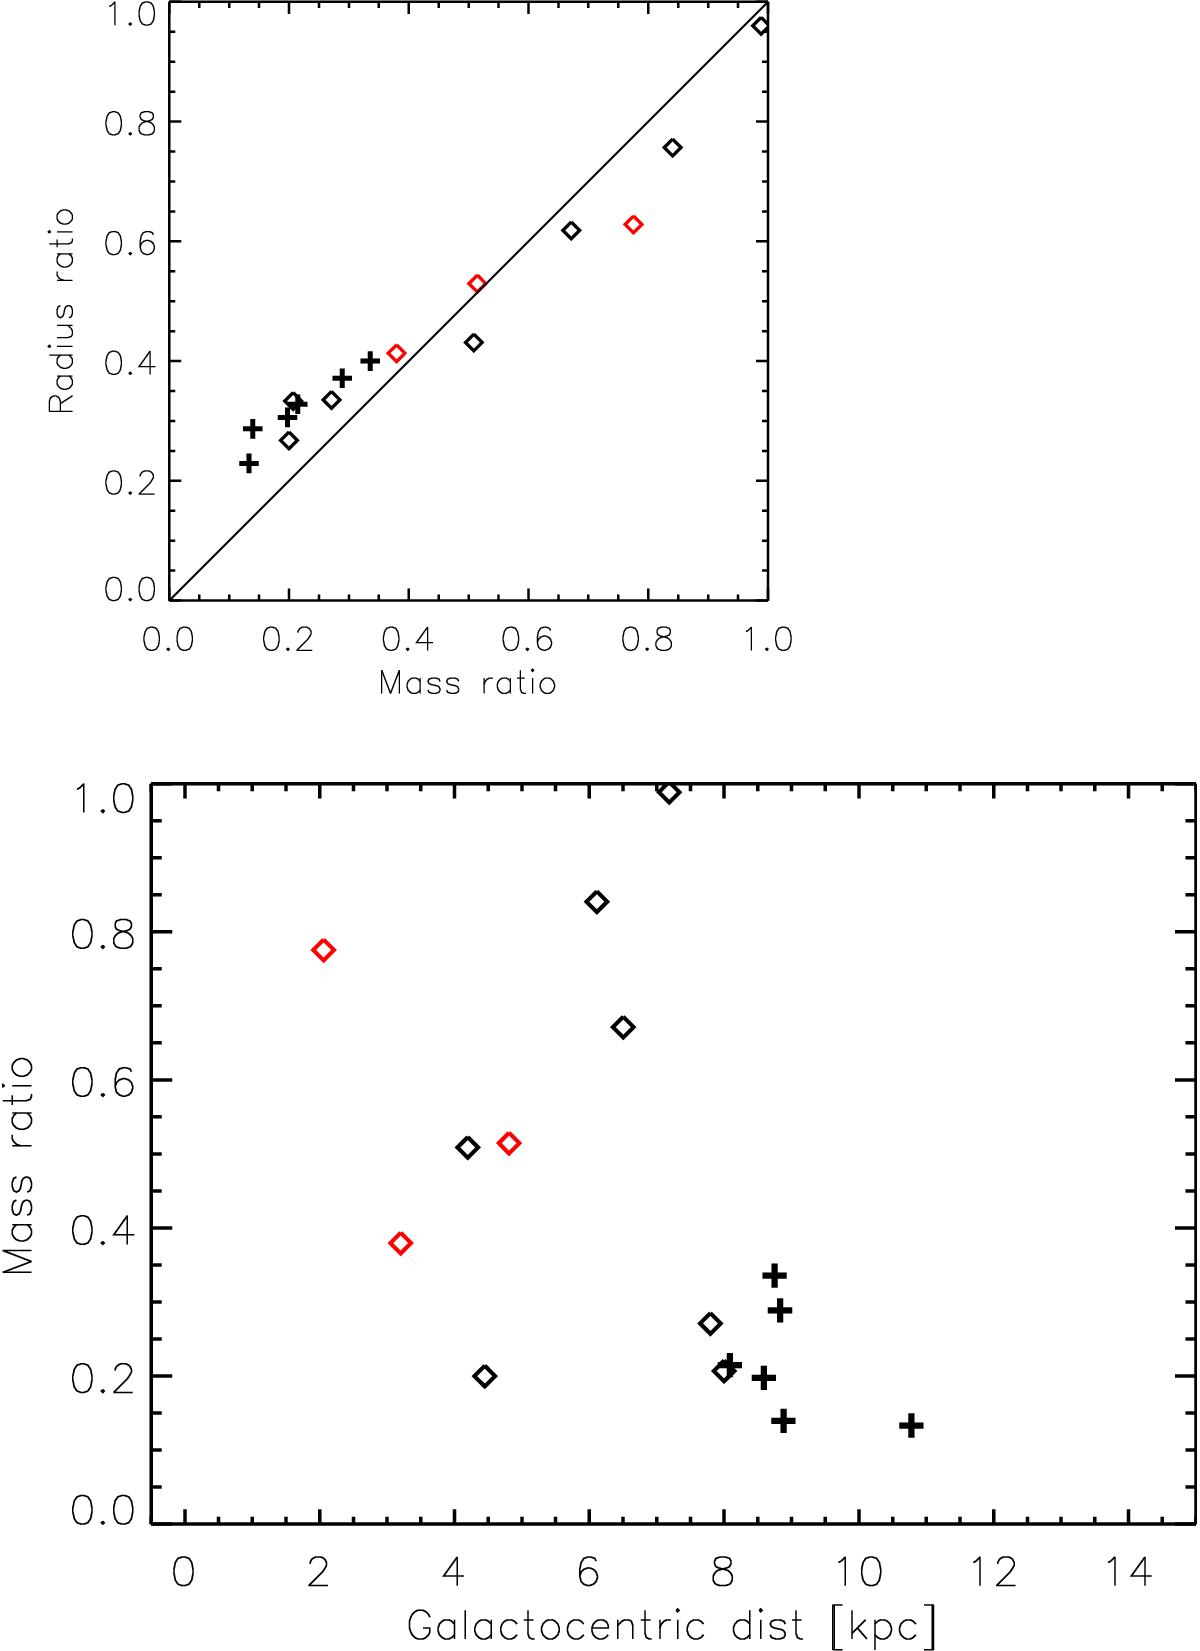
Top: distribution of the size ratio [Size(1022 cm-2)/Size(3 × 1021 cm-2)] as a function of the mass ratio [Mass(1022 cm-2)/Mass(3 × 1021 cm-2)] for two different column density thresholds: 3 × 1021 cm-2 and 1022 cm-2. Bottom: distribution of the mass ratio as a function of the Galactocentric distance. On both plots, red and black symbols indicate the clumps from Category I and II, respectively. Plus signs indicate the clumps in the outer part of the Galaxy and diamonds indicate the sources in the inner Galaxy.
Current usage metrics show cumulative count of Article Views (full-text article views including HTML views, PDF and ePub downloads, according to the available data) and Abstracts Views on Vision4Press platform.
Data correspond to usage on the plateform after 2015. The current usage metrics is available 48-96 hours after online publication and is updated daily on week days.
Initial download of the metrics may take a while.