Fig. 8
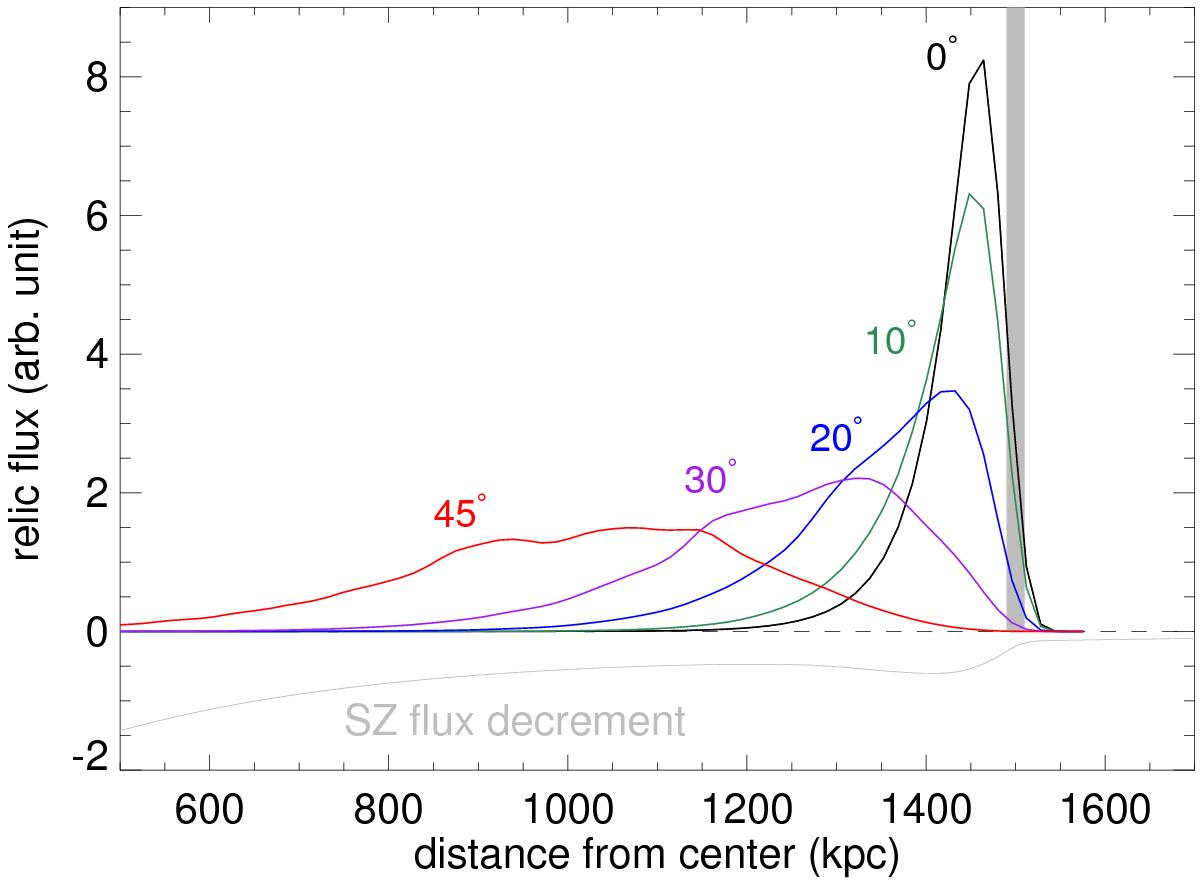
Radio relic with a lognormal emissivity model from different viewing angles. For this illustration we use a relic with dimension 500 kpc at a distance of 1.5 Mpc from a cluster center, situated at z = 0.2, and simulate an observation with resolution 10′′. The gray vertical band shows the location of the shock front and a negative SZ flux profile is included for comparison.
Current usage metrics show cumulative count of Article Views (full-text article views including HTML views, PDF and ePub downloads, according to the available data) and Abstracts Views on Vision4Press platform.
Data correspond to usage on the plateform after 2015. The current usage metrics is available 48-96 hours after online publication and is updated daily on week days.
Initial download of the metrics may take a while.