Fig. 7
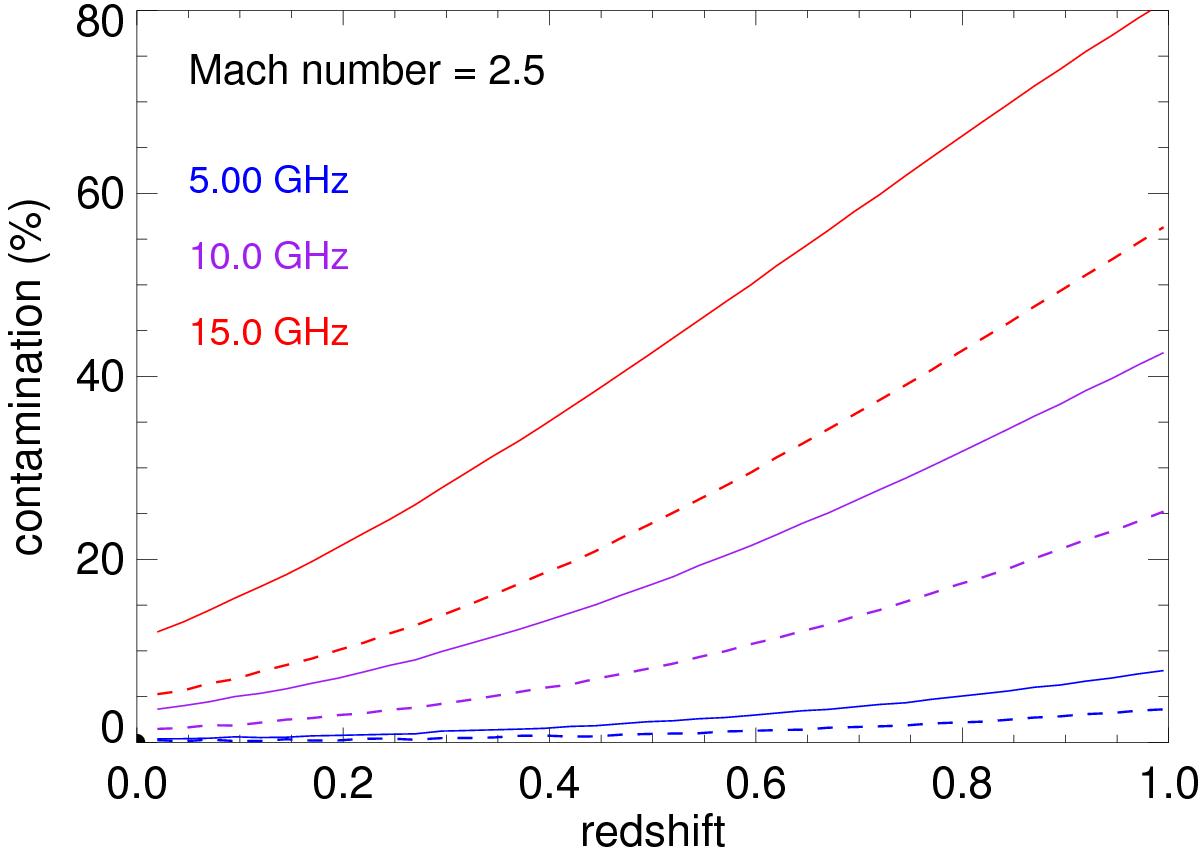
SZ contamination in measured radio fluxes with increasing redshifts for two different cluster masses. The solid lines are for a cluster with mass M500 = 4 × 10¹⁴M⊙, and the dashed lines are for a higher mass, M500 = 1 × 10¹⁵M⊙. Three different colors correspond to three observing frequencies, and we use a ℳ = 2.5 shock with relic LLS = 0.5 Mpc, at 1 Mpc cluster-centric distance. We use an empirical relic power-to-cluster mass scaling, Pν ∝ M2.8, from de Gasperin et al. (2014), which is stronger than the cluster SZ signal scaling. Hence the contamination decreases with increasing cluster mass.
Current usage metrics show cumulative count of Article Views (full-text article views including HTML views, PDF and ePub downloads, according to the available data) and Abstracts Views on Vision4Press platform.
Data correspond to usage on the plateform after 2015. The current usage metrics is available 48-96 hours after online publication and is updated daily on week days.
Initial download of the metrics may take a while.