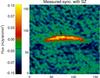
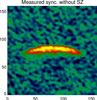
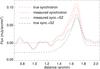
Fig. 6
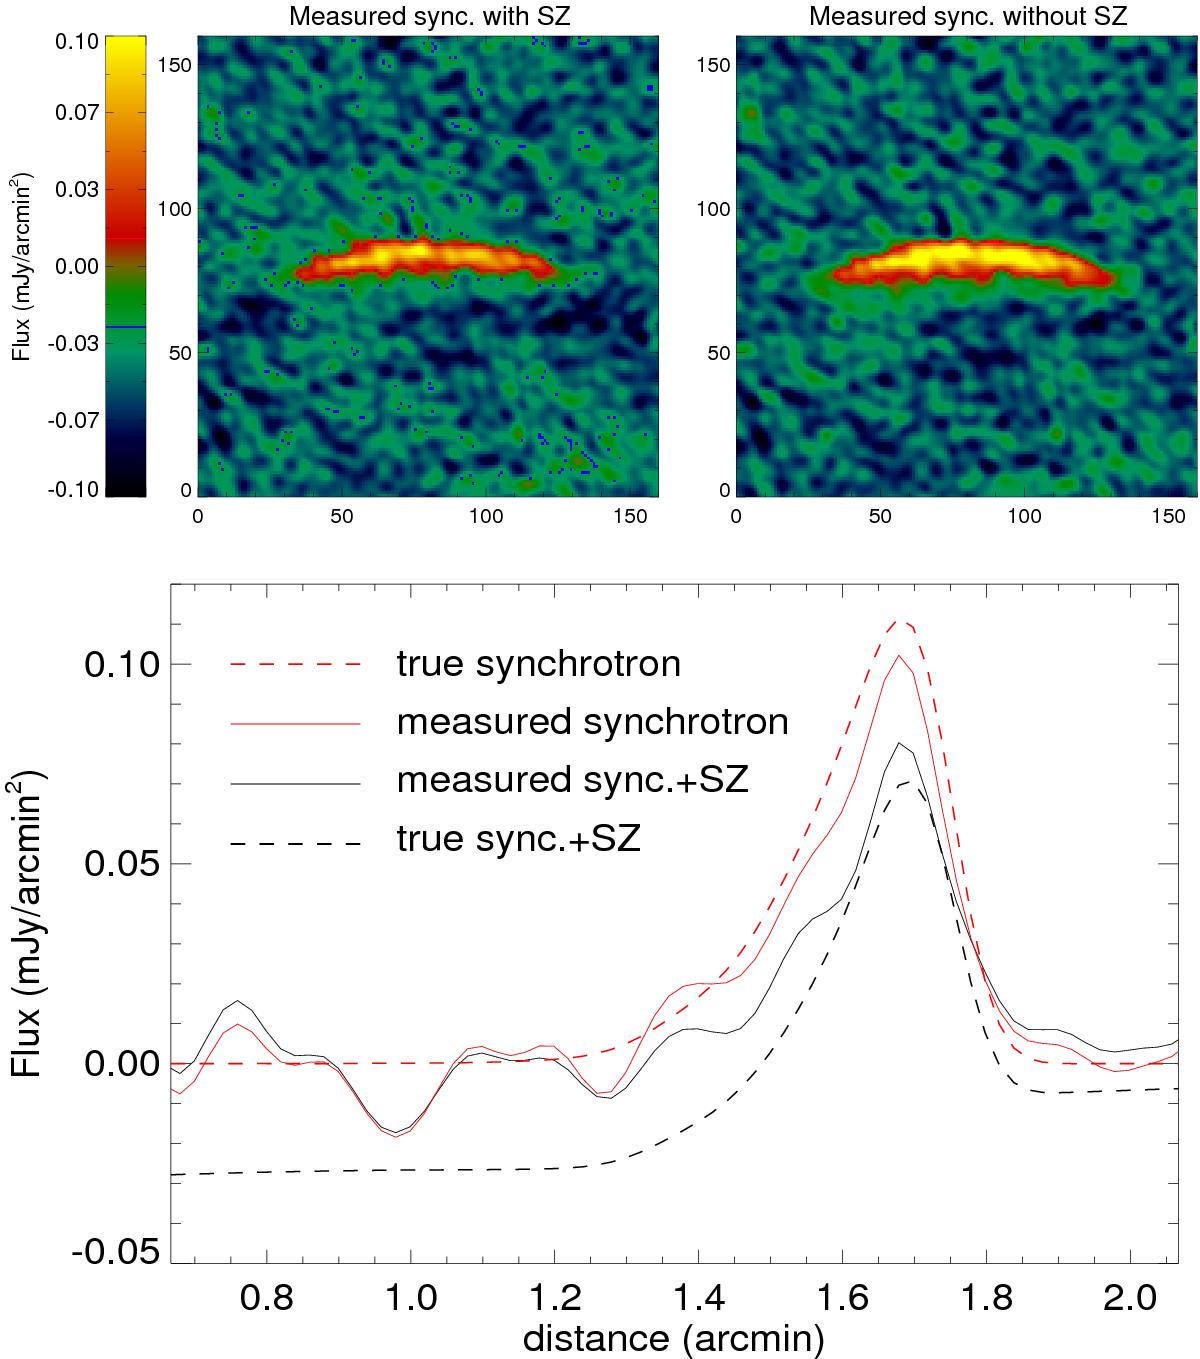
Simulated interferometric observation at 10 GHz for an El Gordo-type compact relic with the VLA X-band. Simulations are performed by the CASA software and CLEANed interactively. Top panel left: actual measurement of the radio relic in the presence of SZ flux contamination. Top panel right: hypothetical measurement of only the synchrotron emission without any SZ. The image axes are in arcseconds, both cases use the same noise realization, and are shown in the same color scales. Bottom panel: flux profiles before and after processing through the simulation setup. The red dashed line shows the input synchrotron-only model, and the black dashed line indicates the synchrotron+SZ input model. Red solid line shows the effect of interferometer on a synchrotron-only flux measurement, which also registers some flux loss due to lack of short baselines. The black solid line refers to the actual observed flux with interferometers when SZ is also taken into account.
Current usage metrics show cumulative count of Article Views (full-text article views including HTML views, PDF and ePub downloads, according to the available data) and Abstracts Views on Vision4Press platform.
Data correspond to usage on the plateform after 2015. The current usage metrics is available 48-96 hours after online publication and is updated daily on week days.
Initial download of the metrics may take a while.