Fig. 3
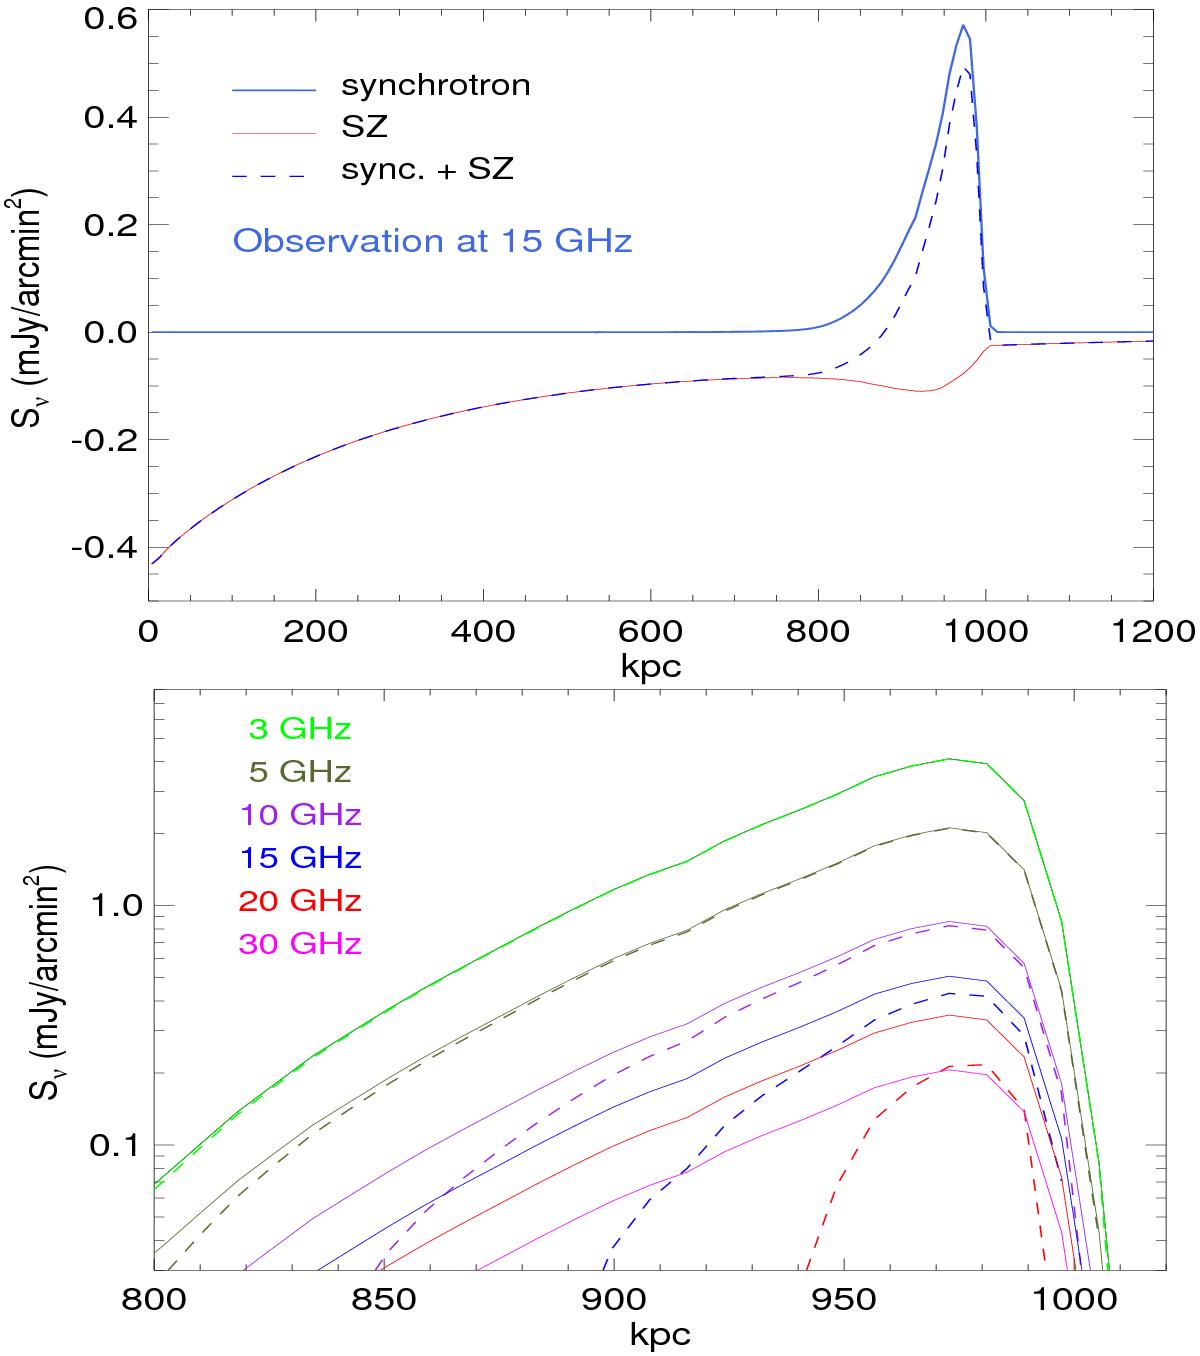
Illustration of the SZ and synchrotron flux profiles across the location of a relic shock at 1 Mpc. The construction of the SZ and synchrotron fluxes are described in Sects. 2.1 and 2.3, respectively, and the example cluster is similar to the Sausage relic cluster. In the top panel we show the case at a single frequency (15 GHz) for the full projected scale length of the cluster. The blue dashed line shows the modified radio flux. In the bottom panel the true and observed synchrotron fluxes are shown in solid and dashed lines in log scale. At 30 GHz the signal is negative throughout because of the SZ decrement, although interferometric observation will be able to recover some positive signal (see Sect. 2.5). For relics with significant inclination angles the synchrotron profile is modified while keeping the SZ unchanged (Sect. 3.1.2).
Current usage metrics show cumulative count of Article Views (full-text article views including HTML views, PDF and ePub downloads, according to the available data) and Abstracts Views on Vision4Press platform.
Data correspond to usage on the plateform after 2015. The current usage metrics is available 48-96 hours after online publication and is updated daily on week days.
Initial download of the metrics may take a while.