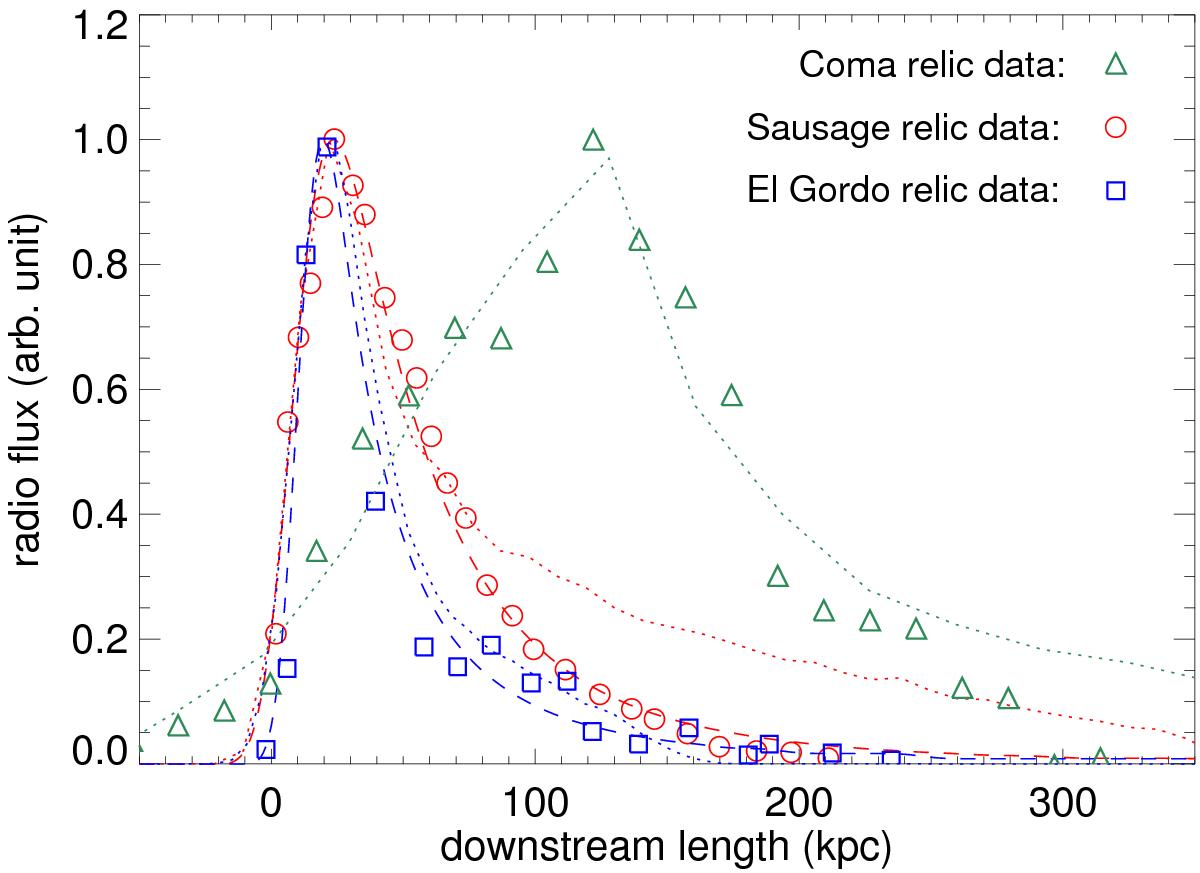
Fig. 2

Fit to the observed flux profiles for three radio relics with our lognormal model. The three different colored symbols represent the flux profile data points in units of physical length, and the dashed and dotted lines with corresponding colors show model fits. The data points are from van Weeren et al. (2010) for the Sausage relic, Lindner et al. (2014) for the El Gordo NW relic, and Trasatti et al. (in prep.) for the Coma relic, all normalized to the same amplitude. For the roughly edge-on relics (Sausage and El Gordo), we show results for two different methods of obtaining a fit: one by directly fitting the projected brightness profile in 1D (dashed lines), and the other using a 3D emissivity model and fitting through projection (dotted lines). The second method produces a long emission tail for the Sausage relic. For the Coma data only a 3D result is shown, which provides an acceptable fit after accounting for a ~30° viewing angle (see text). The models are convolved with the respective instrument resolutions as noted in the publications. The shock location is at zero; cluster center is to the right.
Current usage metrics show cumulative count of Article Views (full-text article views including HTML views, PDF and ePub downloads, according to the available data) and Abstracts Views on Vision4Press platform.
Data correspond to usage on the plateform after 2015. The current usage metrics is available 48-96 hours after online publication and is updated daily on week days.
Initial download of the metrics may take a while.


