Fig. 12
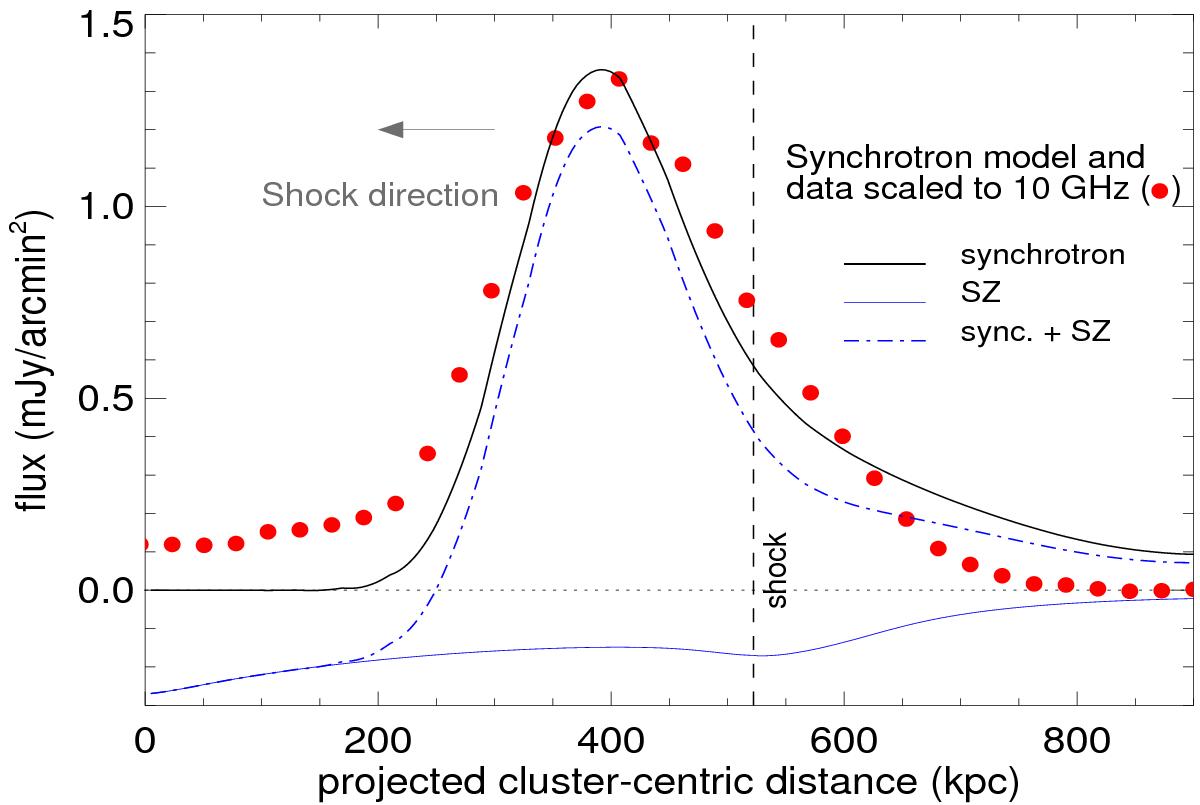
Schematic model for the synchrotron and SZ flux profiles for the A2256 relic at 10 GHz. The geometry assumes a ℳ = 2 shock propagating inward at roughly 500 kpc distance from the cluster center, and viewed at an angle of 40°. The black solid line is the synchrotron flux profile, and the blue dot-dashed line is the SZ profile. The red points are the measured 1.4 GHz flux density values from Clarke & Ensslin (2006), scaled to the considered frequency.
Current usage metrics show cumulative count of Article Views (full-text article views including HTML views, PDF and ePub downloads, according to the available data) and Abstracts Views on Vision4Press platform.
Data correspond to usage on the plateform after 2015. The current usage metrics is available 48-96 hours after online publication and is updated daily on week days.
Initial download of the metrics may take a while.