Fig. 11
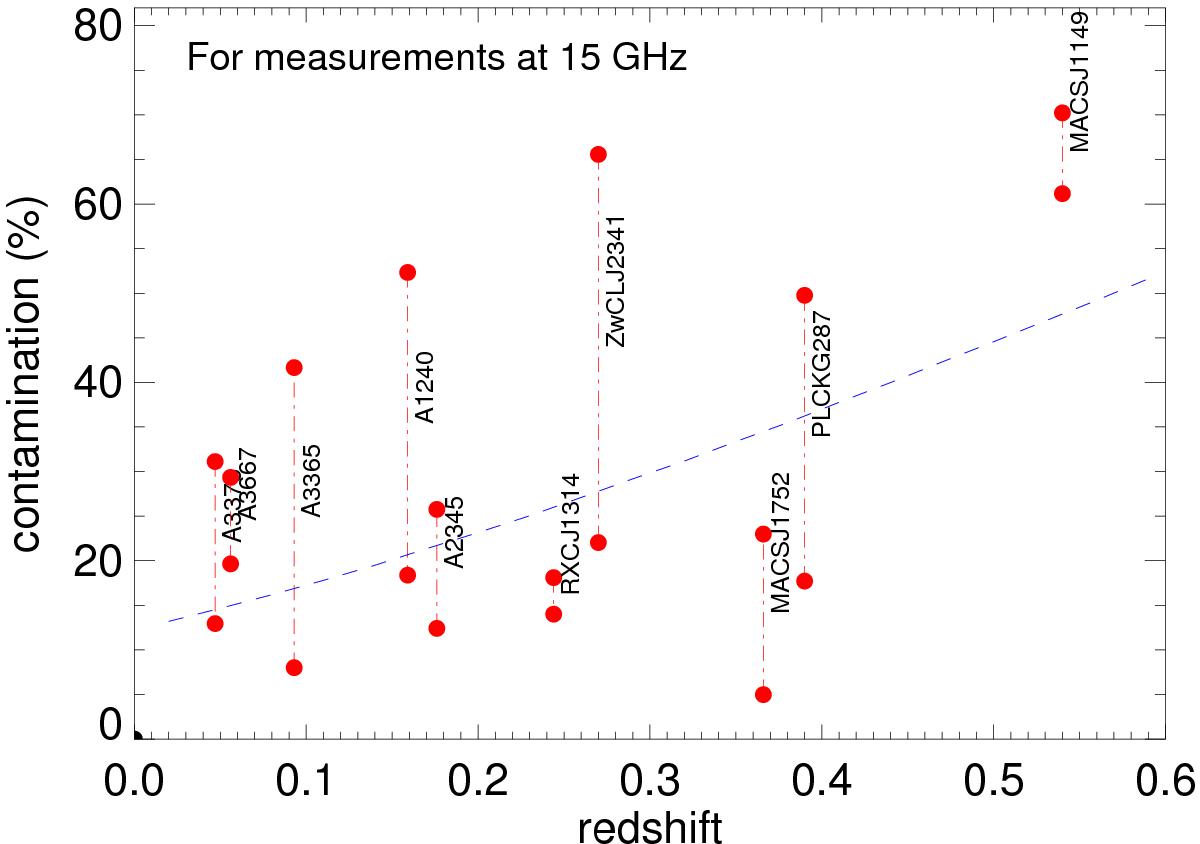
Contamination predictions for a set of double relics in ten galaxy clusters, for whom the edge-on geometry can be applied with reasonable confidence. The relic dimensions and flux measurements are compiled by de Gasperin et al. (2014) and Vazza et al. (2015); the SZ predictions are calibrated against actual Y500 values derived from Planck data. The blue dashed line is the mean contamination prediction from our modeling (see Sect. 3.1.1), using the mean cluster mass and shock parameters for this sample. Red dot-dashed lines connect the relic pairs for easier identification.
Current usage metrics show cumulative count of Article Views (full-text article views including HTML views, PDF and ePub downloads, according to the available data) and Abstracts Views on Vision4Press platform.
Data correspond to usage on the plateform after 2015. The current usage metrics is available 48-96 hours after online publication and is updated daily on week days.
Initial download of the metrics may take a while.