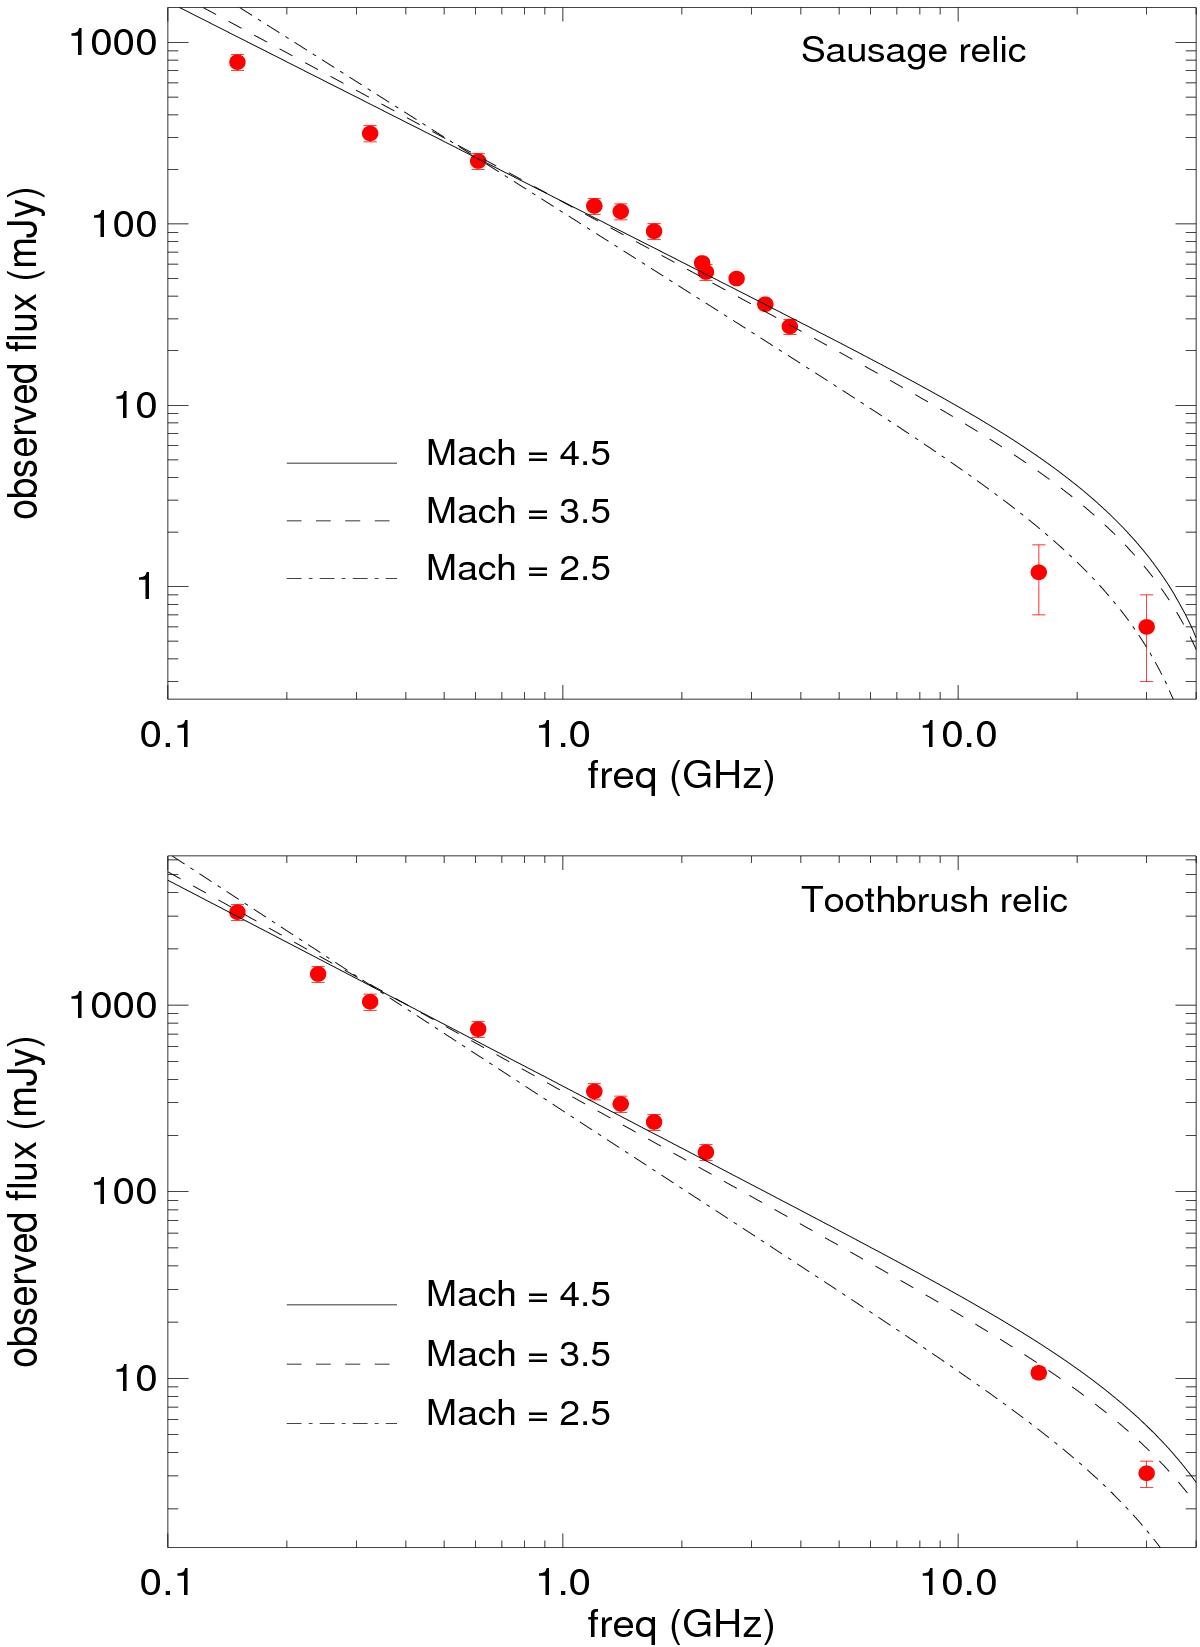
Fig. 10

Interferometric flux measurements of the Sausage relic in CIZA J2248.8+5301 (top panel) and the Toothbrush relic in 1RXS J0603.3+4214 (bottom panel) against our spectral predictions for three different shock Mach numbers. The data are taken from Stroe et al. (2016). The predicted spectra are normalized to have minimum χ2 computed from the low-frequency (≲ 2 GHz) part. These model spectra correspond to an “ideal” measurement, and the results from actual interferometric imaging can differ (see text).
Current usage metrics show cumulative count of Article Views (full-text article views including HTML views, PDF and ePub downloads, according to the available data) and Abstracts Views on Vision4Press platform.
Data correspond to usage on the plateform after 2015. The current usage metrics is available 48-96 hours after online publication and is updated daily on week days.
Initial download of the metrics may take a while.


