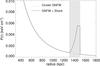
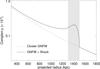
Fig. 1
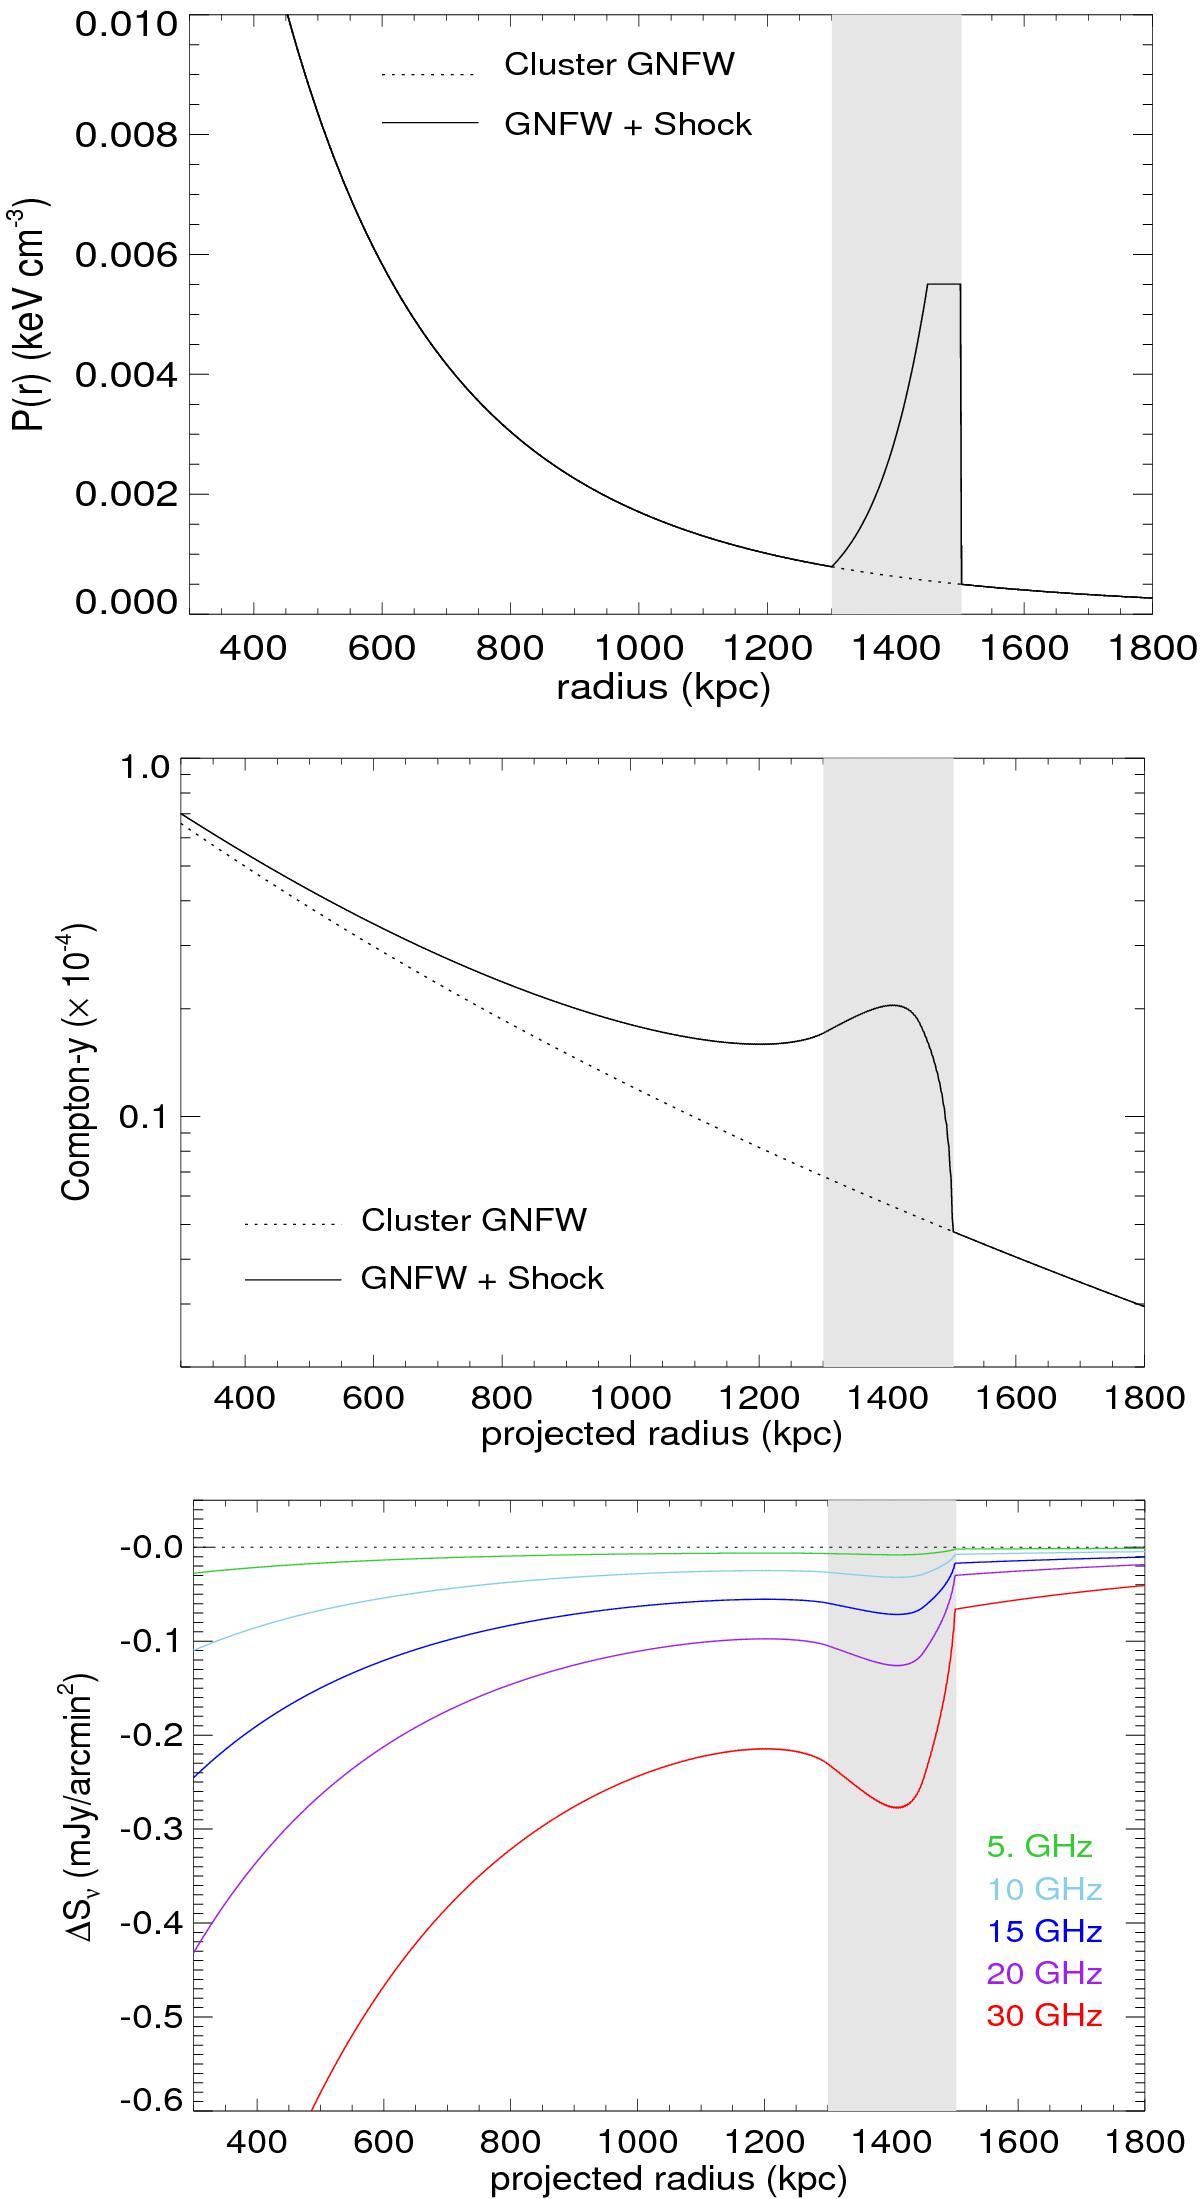
Illustration of SZ flux decrement at a merger shock, for a spherical shock model at 1.5 Mpc distance from the cluster center, in a M500 = 8 × 10¹⁴M⊙ cluster at z = 0.2, with shock Mach number ℳ = 3. The gray vertical bands indicate the approximate pressure-boosted region in radial distance. Top panel: the radial distribution of pressure, demonstrating the localized boost in pressure by roughly factor ~10. The underlying dotted line is the ambient GNFW pressure model proportional to the mass of the cluster. Middle panel: the projected Compton-y parameter, solid line showing the total value. Bottom panel: the resulting SZ flux densities, in units of mJy/arcmin2, as would be observed at different frequencies.
Current usage metrics show cumulative count of Article Views (full-text article views including HTML views, PDF and ePub downloads, according to the available data) and Abstracts Views on Vision4Press platform.
Data correspond to usage on the plateform after 2015. The current usage metrics is available 48-96 hours after online publication and is updated daily on week days.
Initial download of the metrics may take a while.