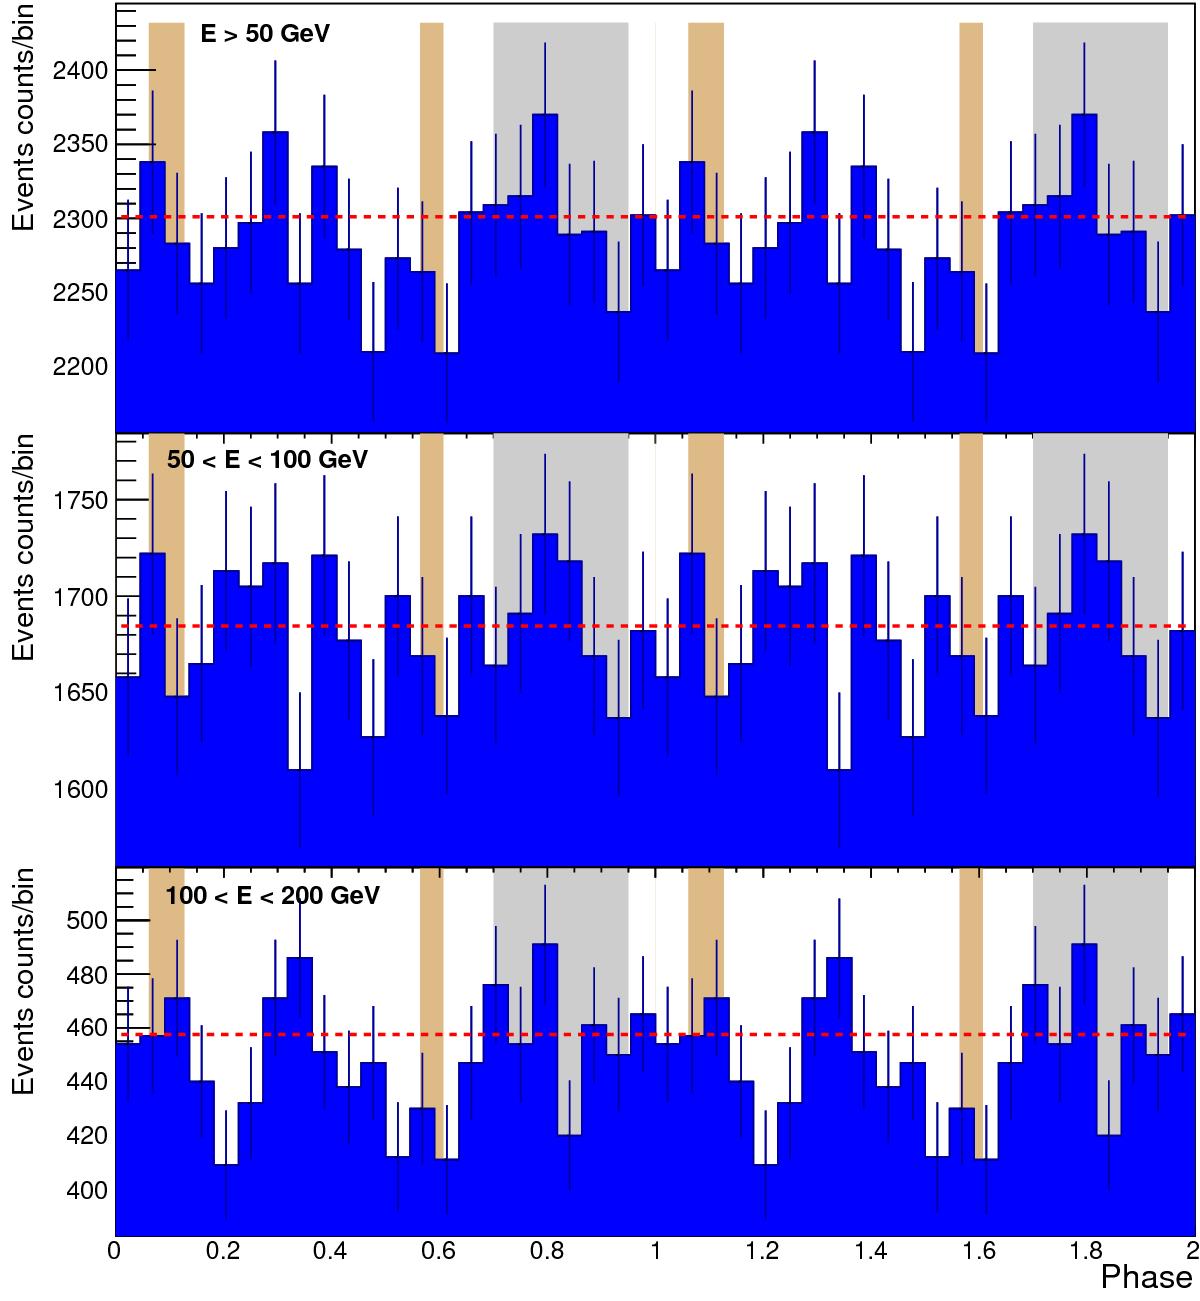
Fig. 3

Light curves of the Geminga pulsar obtained with MAGIC for different energy bins. From top to bottom: above 50 GeV, 50–100 GeV and 100–200 GeV. Two cycles are plotted for clarity. The bin width corresponds to ~10.8 ms (1/22 of the Geminga rotational period). The shaded brown areas show the positions of P1 (main pulse) and P2 (interpulse). The gray area shows the off-region. The dashed red line represents the averaged number of events in the background region.
Current usage metrics show cumulative count of Article Views (full-text article views including HTML views, PDF and ePub downloads, according to the available data) and Abstracts Views on Vision4Press platform.
Data correspond to usage on the plateform after 2015. The current usage metrics is available 48-96 hours after online publication and is updated daily on week days.
Initial download of the metrics may take a while.


