Fig. 1
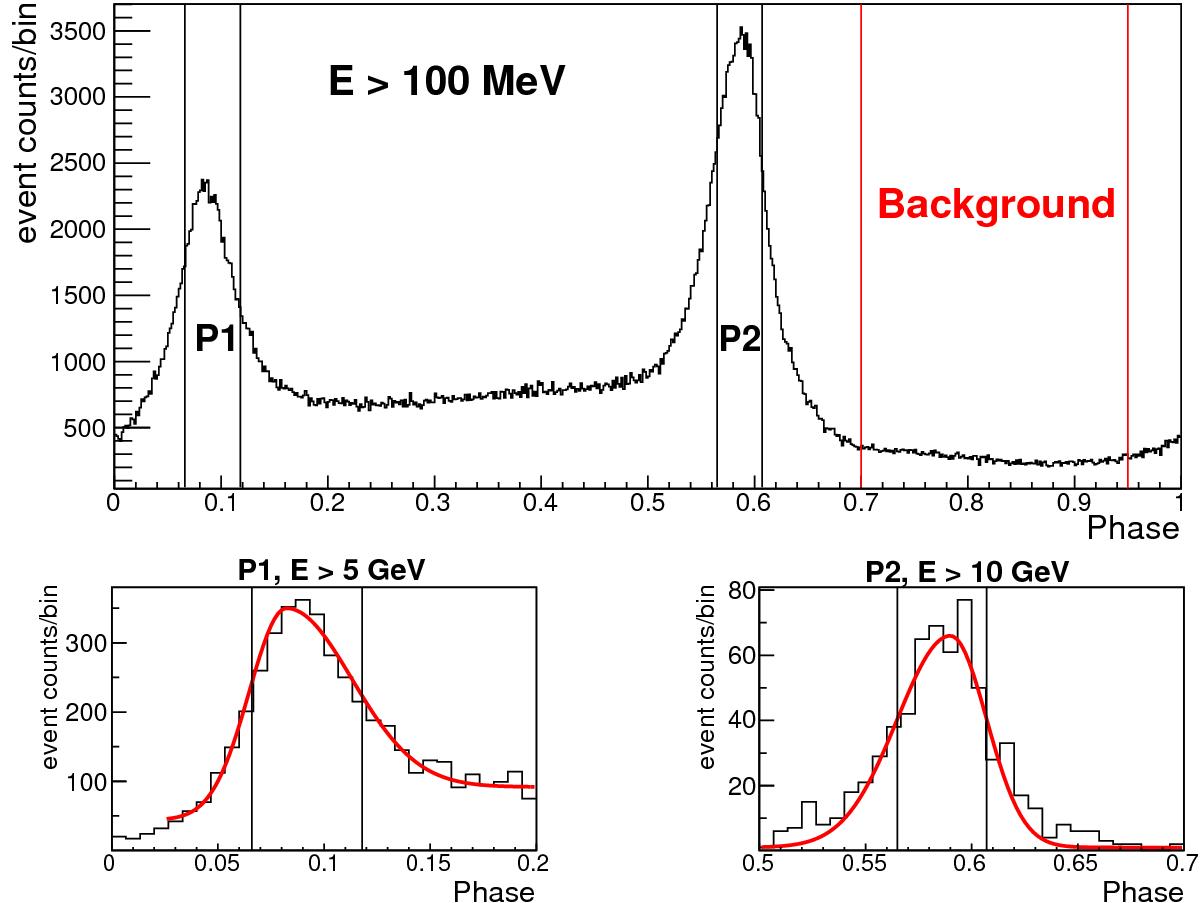
Light curve computed with the Fermi-LAT data above 100 MeV (top). A close-up is made on both P1 above 5 GeV and P2 above 10 GeV and their corresponding Gaussian fits (bottom), with resulting χ2/d.o.f values of 61/26 and 32/29 for P1 and P2, respectively. The vertical black lines define the signal regions, while the vertical red lines define the off-pulse region used to determine the background.
Current usage metrics show cumulative count of Article Views (full-text article views including HTML views, PDF and ePub downloads, according to the available data) and Abstracts Views on Vision4Press platform.
Data correspond to usage on the plateform after 2015. The current usage metrics is available 48-96 hours after online publication and is updated daily on week days.
Initial download of the metrics may take a while.