Fig. 9
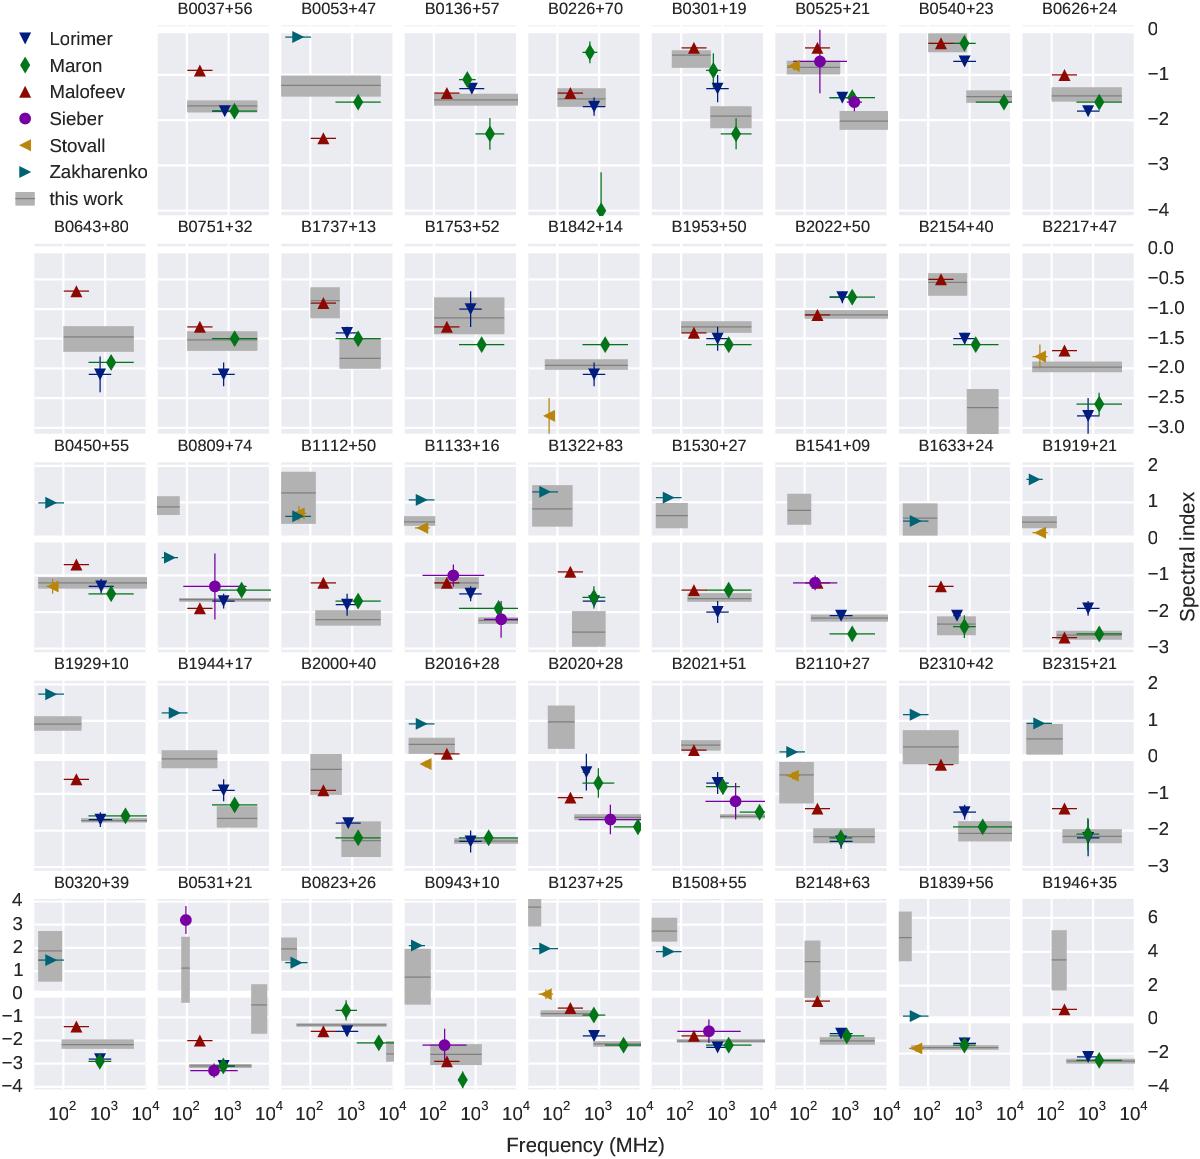
Comparison of spectral indices from this work (grey-shaded rectangles) to the ones reported by Sieber (1973), Lorimer et al. (1995), Maron et al. (2000), Malofeev et al. (2000), Zakharenko et al. (2013), and Stovall et al. (2015) (coloured points with error bars). The horizontal extent of grey rectangles and horizontal error bars on literature values represent the frequency range over which the index was measured. The vertical extent/error bar marks the reported uncertainty (for Malofeev et al. 2000 and Zakharenko et al. 2013 no errors were given). Spectral fits in this work include data points from all these works together with other published values and our own measurements. The pulsars are grouped by the spectral index plotting limits and ordered by right ascension within each group.
Current usage metrics show cumulative count of Article Views (full-text article views including HTML views, PDF and ePub downloads, according to the available data) and Abstracts Views on Vision4Press platform.
Data correspond to usage on the plateform after 2015. The current usage metrics is available 48-96 hours after online publication and is updated daily on week days.
Initial download of the metrics may take a while.