Fig. 8
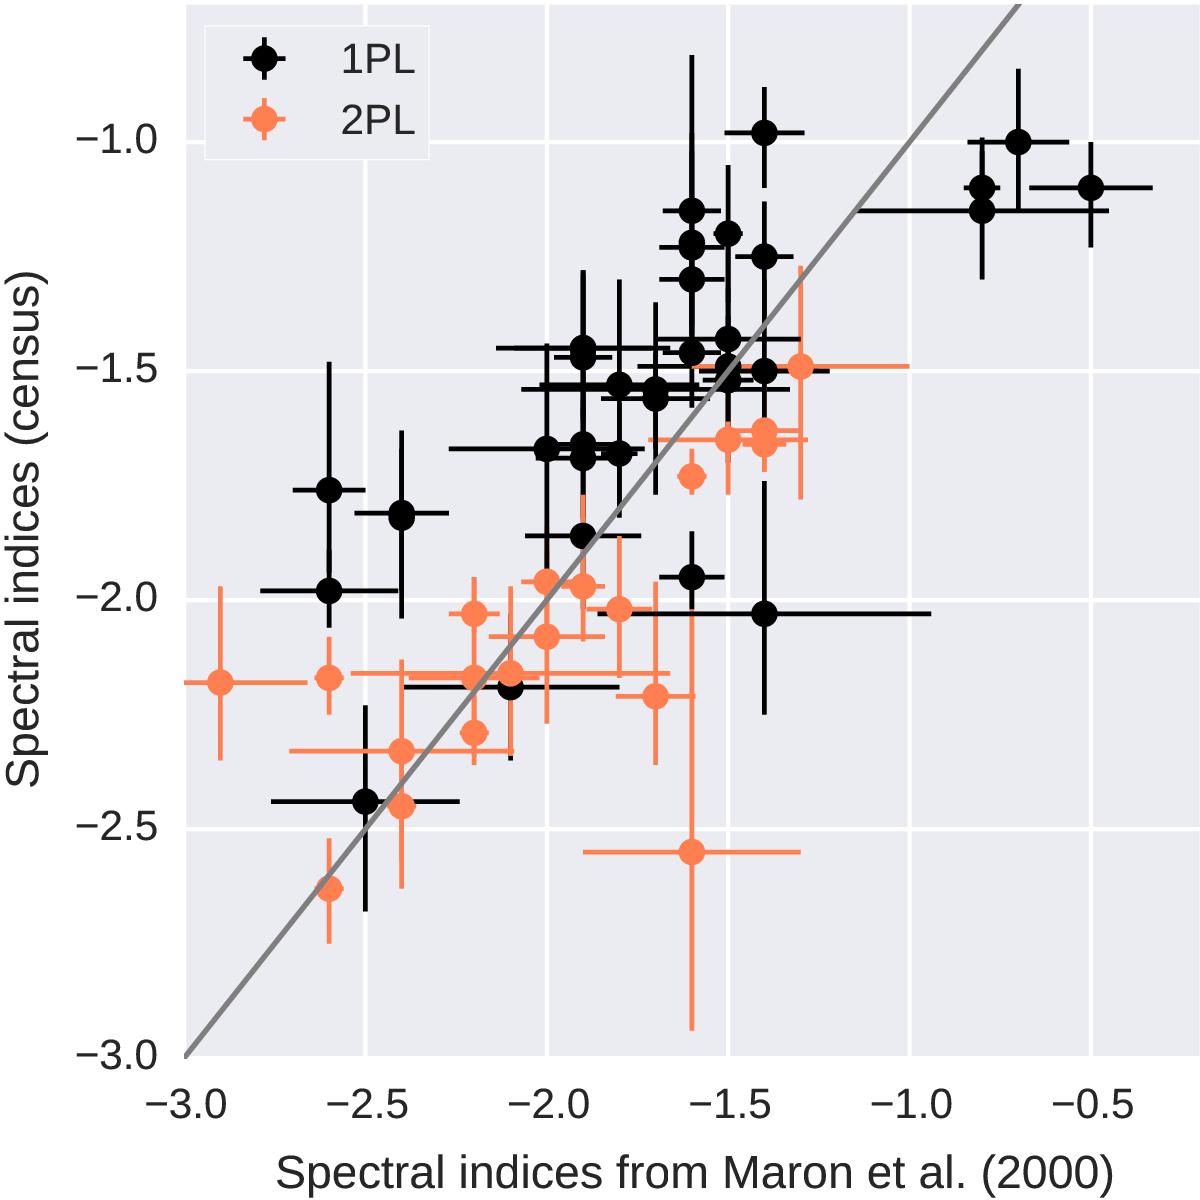
Comparison between spectral indices from Maron et al. (2000) and this work. Black circles indicate 35 pulsars with spectra best described with a single PL by Maron et al. (frequency range of 400 MHz–1.6/5 GHz) and a single PL in our work (frequency range of typically 100 MHz–5 GHz). The spectral indices in our work tend to be more flat, indicating a possible low-frequency turnover somewhere close to 100 MHz. For comparison, spectral indices for 21 pulsars with clearly identified low-frequency turnovers below the frequency range of Maron et al. (2000) are shown with orange circles.
Current usage metrics show cumulative count of Article Views (full-text article views including HTML views, PDF and ePub downloads, according to the available data) and Abstracts Views on Vision4Press platform.
Data correspond to usage on the plateform after 2015. The current usage metrics is available 48-96 hours after online publication and is updated daily on week days.
Initial download of the metrics may take a while.