Fig. 7
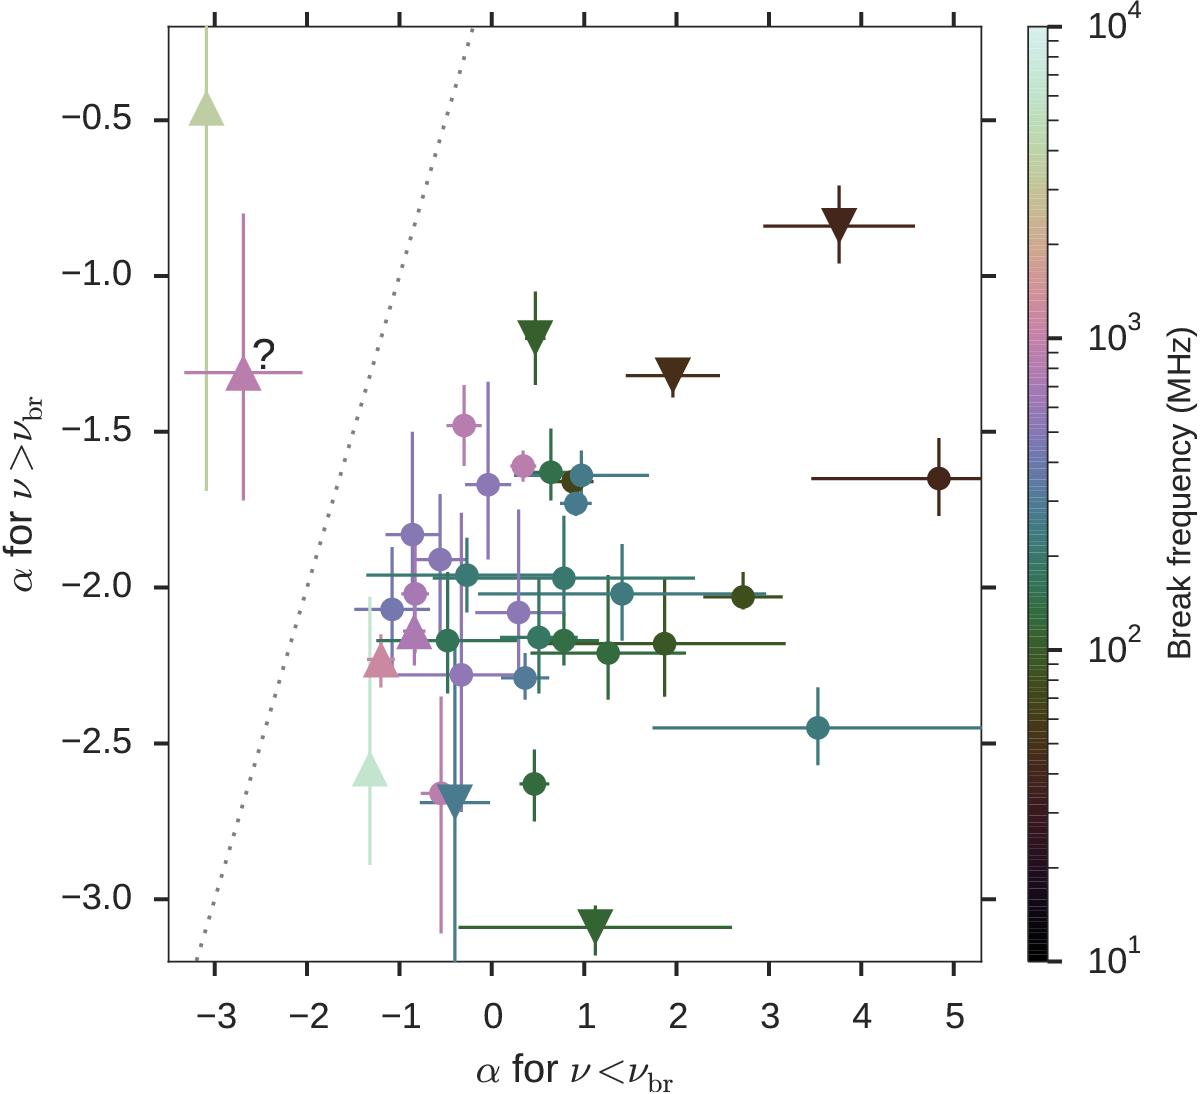
Spectral indices below and above the spectral break for 32 pulsars with relatively well-measured spectra (see text for details). Pulsars with a single spectral break are marked with circles. For pulsars with two spectral breaks, the lower-frequency one is marked with the downward triangles and the higher-frequency one with the upward triangles. The colour indicates the frequency of the break and the dotted line corresponds to no change in the spectral index. The question mark indicates PSR B2303+30, for which the value of the high-frequency spectral index was greatly influenced by a single flux density measurement. Note that for νbr ≳ 500 MHz the change in spectral index is relatively moderate, whereas for νbr ≲ 300 MHz the spectral index below the break takes (sometimes large) positive values. This corresponds to the previously known “high-frequency cut-off” and “low-frequency turnover” in pulsar spectra.
Current usage metrics show cumulative count of Article Views (full-text article views including HTML views, PDF and ePub downloads, according to the available data) and Abstracts Views on Vision4Press platform.
Data correspond to usage on the plateform after 2015. The current usage metrics is available 48-96 hours after online publication and is updated daily on week days.
Initial download of the metrics may take a while.