Fig. 6
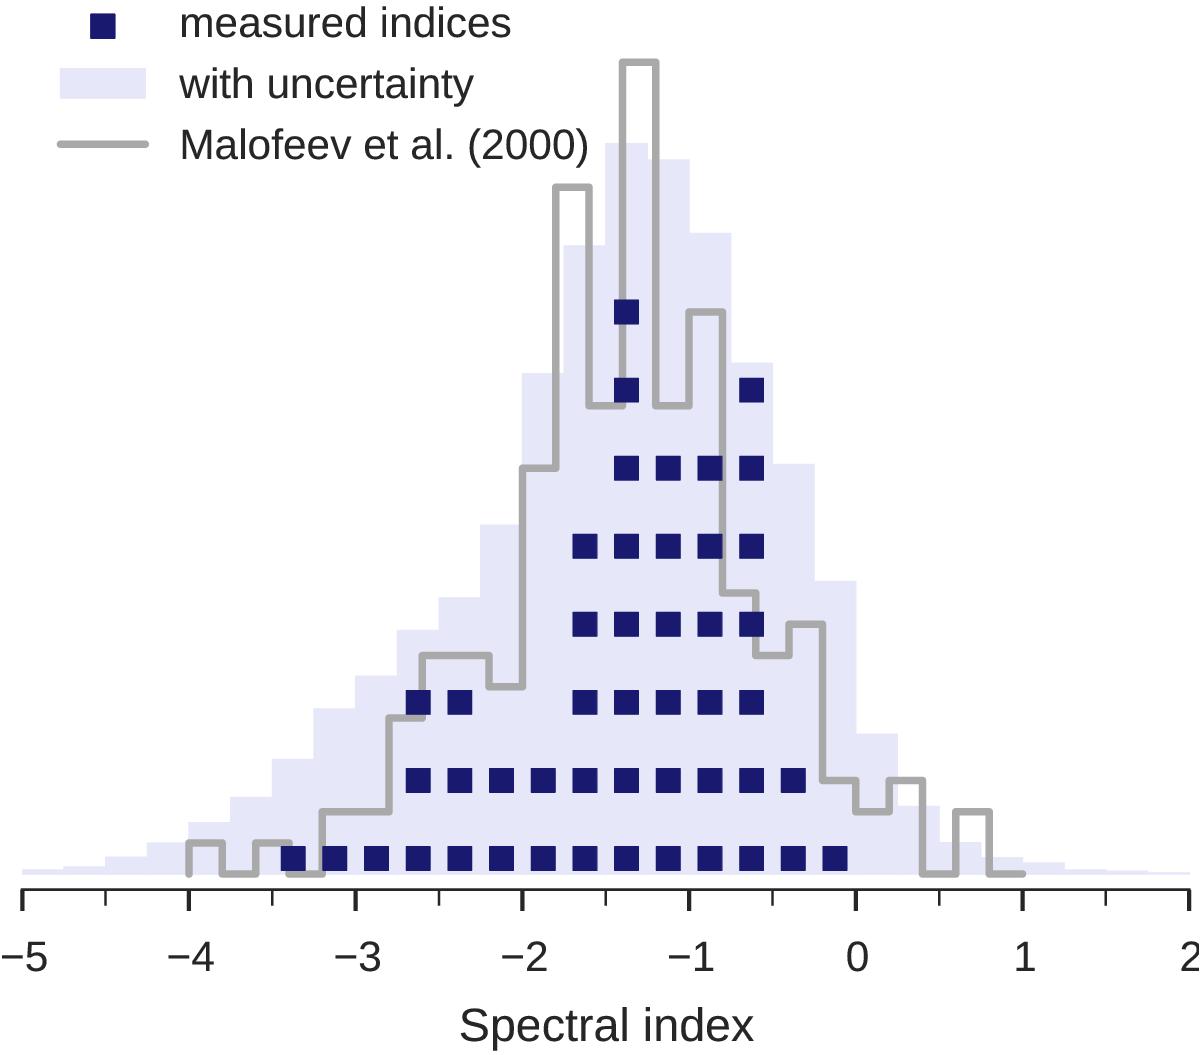
Distribution of spectral indices for 48 pulsars without previously published spectral fits. Each of the 48 dark squares marks the mean of the posterior distribution of the spectral index α. The lighter histogram was constructed using the whole posterior distribution of α for all pulsars, and thus reflects the uncertainty in the spectral index determination. The grey line marks the distribution of spectral indices for 175 non-recycled pulsars in the similar frequency range (100–400 MHz) from Malofeev et al. (2000).
Current usage metrics show cumulative count of Article Views (full-text article views including HTML views, PDF and ePub downloads, according to the available data) and Abstracts Views on Vision4Press platform.
Data correspond to usage on the plateform after 2015. The current usage metrics is available 48-96 hours after online publication and is updated daily on week days.
Initial download of the metrics may take a while.