Fig. 5
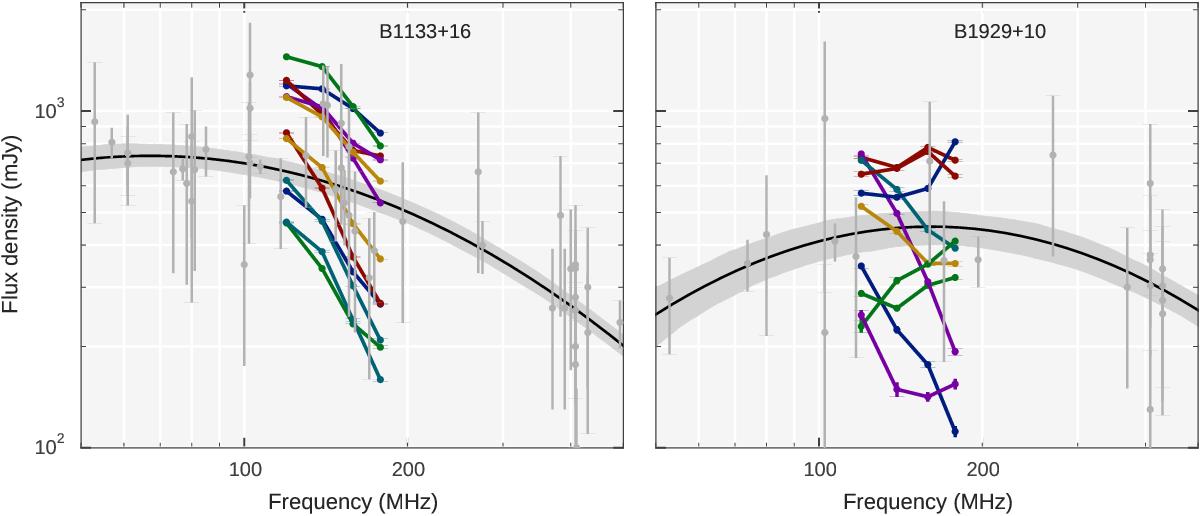
Flux density measurements from individual timing sessions (Smeas, coloured connected dots) for two out of the ten pulsars used for flux density uncertainty estimates. Separate grey dots are flux density values from the literature, with the errors estimated according to the procedure described in Sect. 5.2. The black line indicates Slit, the parabola fit for literature flux density points within 10−1000 MHz. The shaded region marks 68% uncertainty on Slit.
Current usage metrics show cumulative count of Article Views (full-text article views including HTML views, PDF and ePub downloads, according to the available data) and Abstracts Views on Vision4Press platform.
Data correspond to usage on the plateform after 2015. The current usage metrics is available 48-96 hours after online publication and is updated daily on week days.
Initial download of the metrics may take a while.