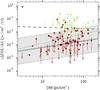
Fig. 4
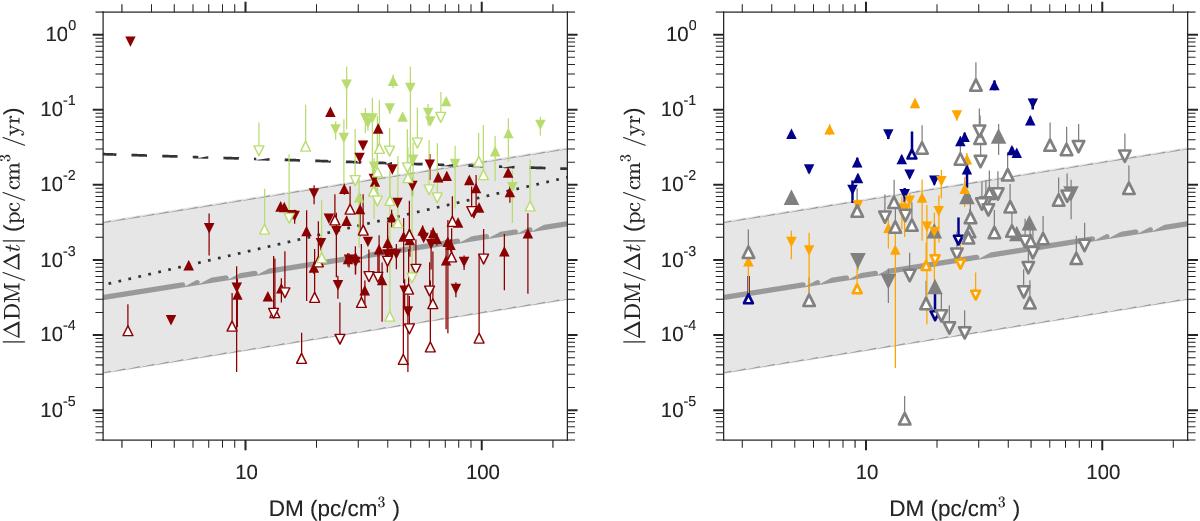
DM variation rates versus census DMs. On both panels the upward/downward triangles indicate DM values increasing/decreasing with time. Unfilled triangles mark pulsars without significant DM variation rate (i. e. with | ΔDM/Δt | smaller than its uncertainty). For such pulsars the lower parts of the errorbars are not shown. Left: DM variation rates, obtained by comparing census DM measurements to the pulsar catalogue values. Lighter (green) marks show pulsars which have relatively large DM errors (>0.1 pc cm-3), in either the census measurements or the pulsar catalogue. The dotted and dashed lines show unweighted and weighted linear fit to the data in log-log space, respectively, excluding the outlier in the top left corner. The relation of Hobbs et al. (2004b, grey line) is overplotted together with one order-of-magnitude scatter reported by the authors (grey shade). The outlier at DM ≈ 3 pc cm-3, PSR J1503+2111 is discussed in Sect. 3.2. Right: rate of DM variations calculated by comparing census measurements to the recent low-frequency observations of Pilia et al. (2016, larger grey markers), Stovall et al. (2015, dark blue markers) and Zakharenko et al. (2013, light orange markers). See text for discussion.
Current usage metrics show cumulative count of Article Views (full-text article views including HTML views, PDF and ePub downloads, according to the available data) and Abstracts Views on Vision4Press platform.
Data correspond to usage on the plateform after 2015. The current usage metrics is available 48-96 hours after online publication and is updated daily on week days.
Initial download of the metrics may take a while.