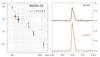
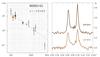
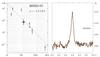
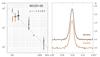
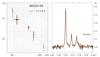
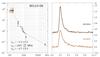
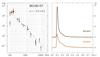
Fig. C.2
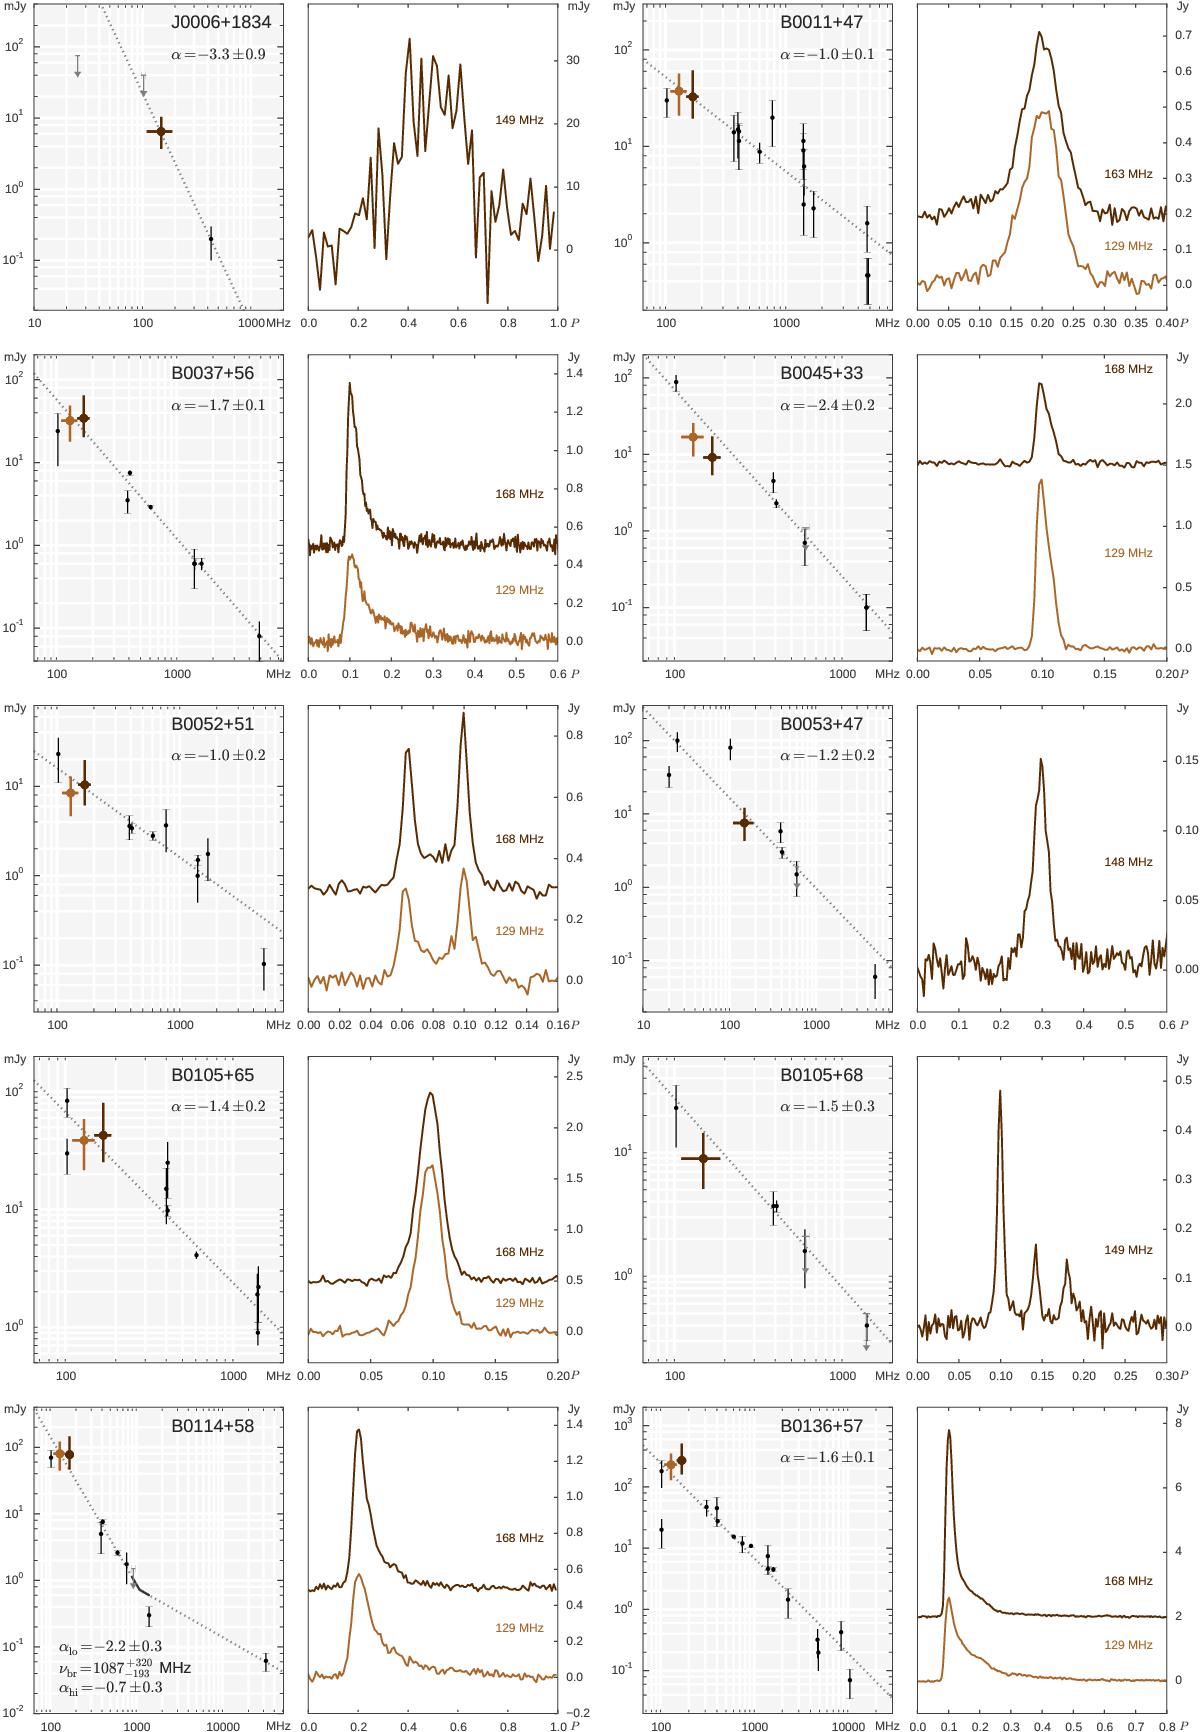
For each pair of plots, Left: spectra of radio emission for pulsars detected in the census. Smaller black error bars mark literature flux densities, the larger coloured dots indicate the census measurements at various frequencies (with the horizontal errorbars indicating the frequency span of a given census measurement). See text for both census and literature flux density errors and upper limit discussion. In the case of a multiple-PL fit, the uncertainty on break frequency is marked with a broken black line. Right: flux-calibrated average profiles for census observations (only the manually selected on-pulse region is shown). Multiple profiles per band are shown with a constant flux offset between separate sub-bands. The choice of the number of sub-bands was influenced by the peak S/N ratio of the average profile, the presence of profile evolution within the observing band and the number of previously published flux density values.
Current usage metrics show cumulative count of Article Views (full-text article views including HTML views, PDF and ePub downloads, according to the available data) and Abstracts Views on Vision4Press platform.
Data correspond to usage on the plateform after 2015. The current usage metrics is available 48-96 hours after online publication and is updated daily on week days.
Initial download of the metrics may take a while.