Fig. 1
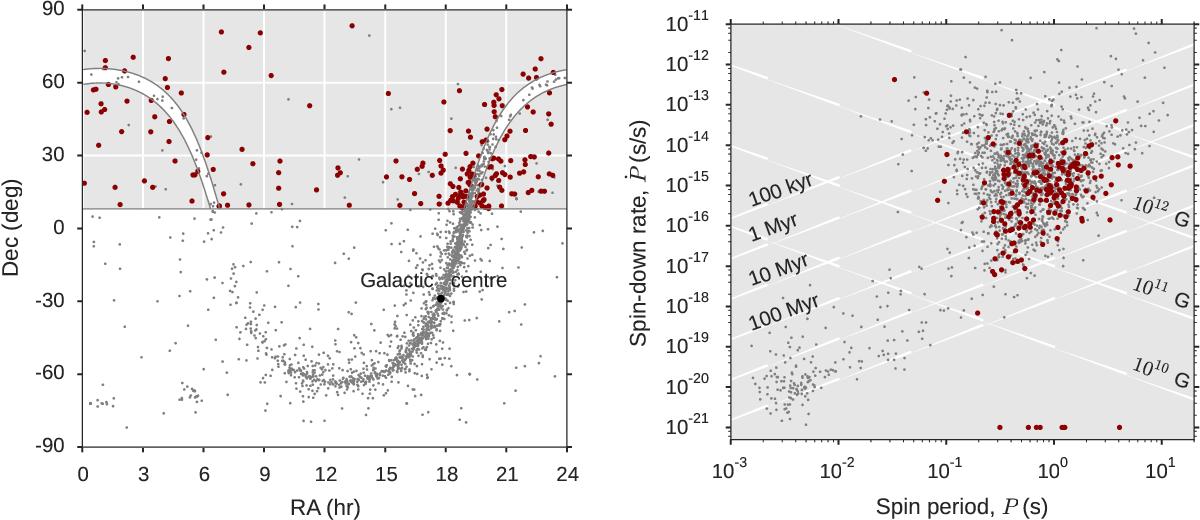
Left: distribution of all known pulsars from the ATNF pulsar catalogue (grey dots) and the LOFAR census pulsars (red circles) on the sky in equatorial coordinates. The cuts in declination and Galactic latitude made for the LOFAR census sample are shown as grey lines (Dec > 8° and | Gb | > 3°, respectively). For the full list of selection criteria see Table 1. Right: distribution of all known pulsars (grey dots) and the LOFAR census pulsars (red circles) on the period–period derivative, P−Ṗ, diagram. Pulsars with an unknown Ṗ are shown at Ṗ = 10-21 s s-1 in the diagram.
Current usage metrics show cumulative count of Article Views (full-text article views including HTML views, PDF and ePub downloads, according to the available data) and Abstracts Views on Vision4Press platform.
Data correspond to usage on the plateform after 2015. The current usage metrics is available 48-96 hours after online publication and is updated daily on week days.
Initial download of the metrics may take a while.