Fig. 14
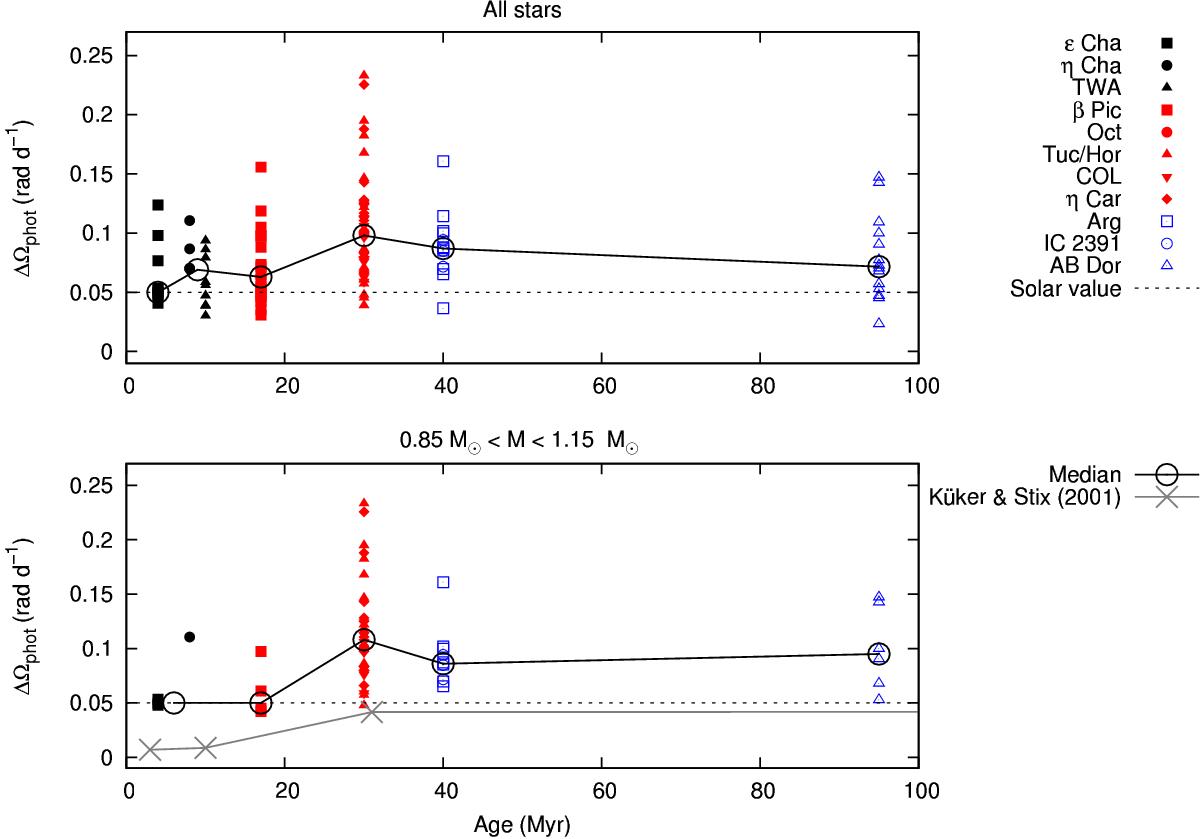
Top panel: ΔΩphot vs. stellar age. The empty circles indicate the median ΔΩphot values measured at different ages (note that the members of ηCha have been grouped with the members of TWA). The black continuous line connects the median ΔΩphot values and the dotted line marks the present solar shear for comparison. Bottom panel: the same plot restricted to stars with mass between 0.9 and 1.1 M⊙. The gray crosses mark the rotational shear for the Sun at different ages, as predicted by Küker & Stix (2001).
Current usage metrics show cumulative count of Article Views (full-text article views including HTML views, PDF and ePub downloads, according to the available data) and Abstracts Views on Vision4Press platform.
Data correspond to usage on the plateform after 2015. The current usage metrics is available 48-96 hours after online publication and is updated daily on week days.
Initial download of the metrics may take a while.