Fig. 13
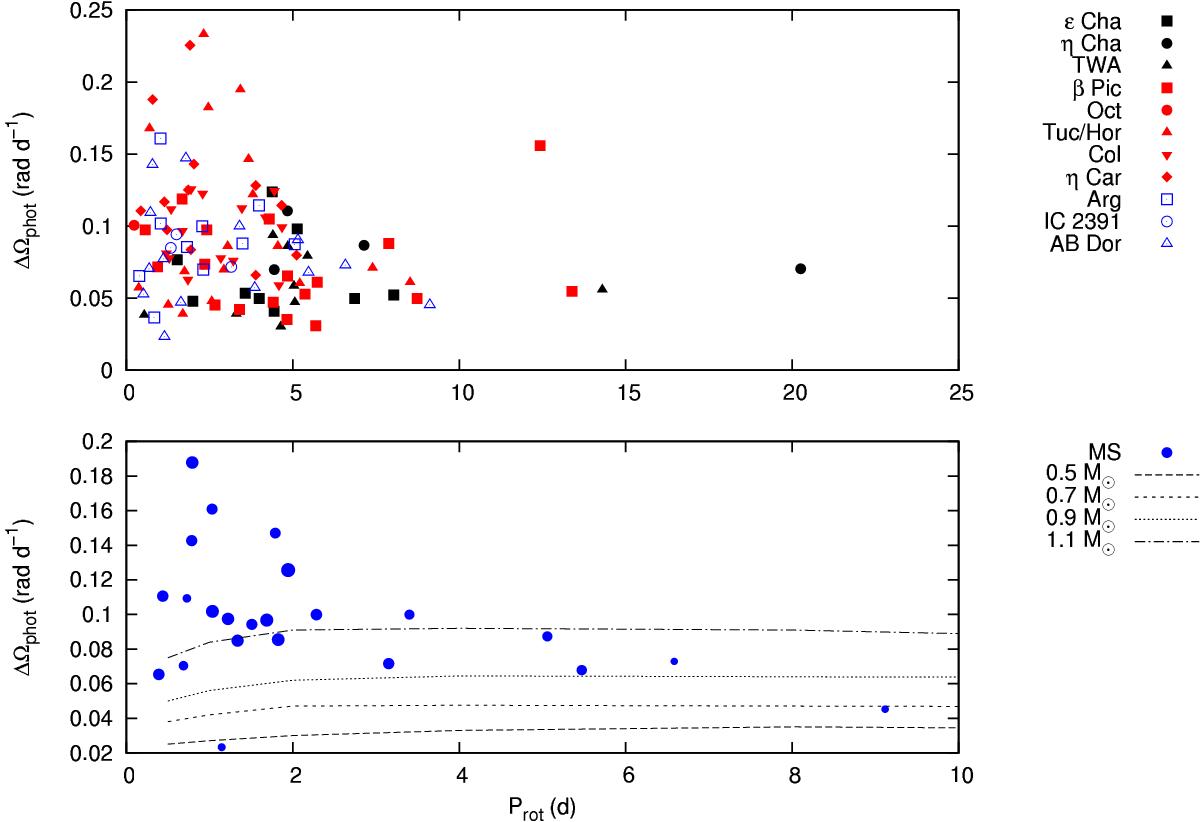
Top panel: ΔΩphot vs. the stellar rotation period Prot. The highest ΔΩphot values have been measured in stars with Prot ≤ 5d. Bottom panel: the same plot restricted to the MS stars. The symbol sizes are proportional to the stellar masses, which range between 0.6 and 1.35 M⊙. The black lines are the rotational tracks derived by Küker & Rüdiger (2011) for stars of 0.5, 0.7, 0.9, and 1.1 M⊙ as labeled.
Current usage metrics show cumulative count of Article Views (full-text article views including HTML views, PDF and ePub downloads, according to the available data) and Abstracts Views on Vision4Press platform.
Data correspond to usage on the plateform after 2015. The current usage metrics is available 48-96 hours after online publication and is updated daily on week days.
Initial download of the metrics may take a while.