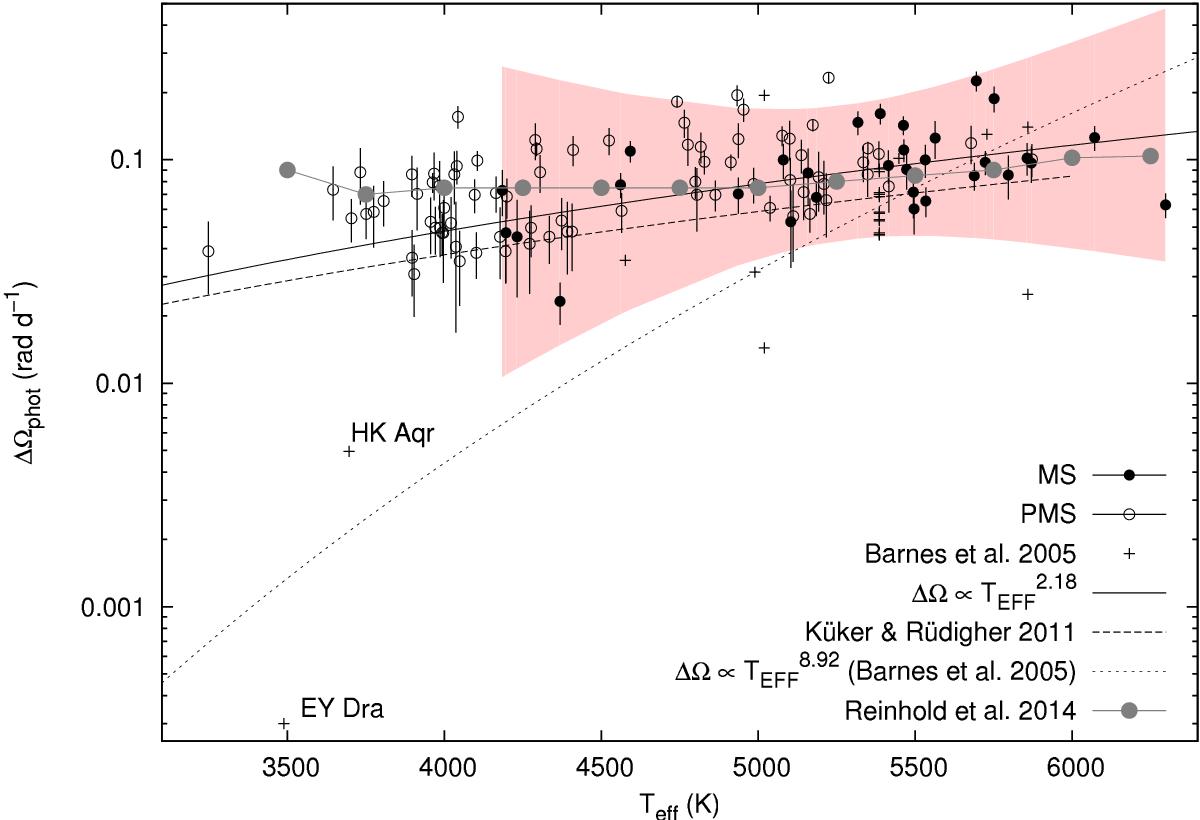
Fig. 11

ΔΩphot vs. the effective temperature Teff. The black bullets indicate the values measured in the present work. The filled bullets show stars that have reached the ZAMS, and the empty bullets show stars that are still contracting. The black crosses indicate the data reported in Barnes et al. (2005). The continuous and the dotted line depict the power law inferred in the present work and that inferred in Barnes et al. (2005). The dashed line indicates the power law predicted by the theoretical model of Küker & Rüdiger (2011). The Teff values have been inferred from the models of Siess et al. (2000). The shaded area represents the uncertainty in our power-law fitting. The large gray bullets and the gray line represent the results of Reinhold et al. (2013).
Current usage metrics show cumulative count of Article Views (full-text article views including HTML views, PDF and ePub downloads, according to the available data) and Abstracts Views on Vision4Press platform.
Data correspond to usage on the plateform after 2015. The current usage metrics is available 48-96 hours after online publication and is updated daily on week days.
Initial download of the metrics may take a while.


