Free Access
Fig. 9
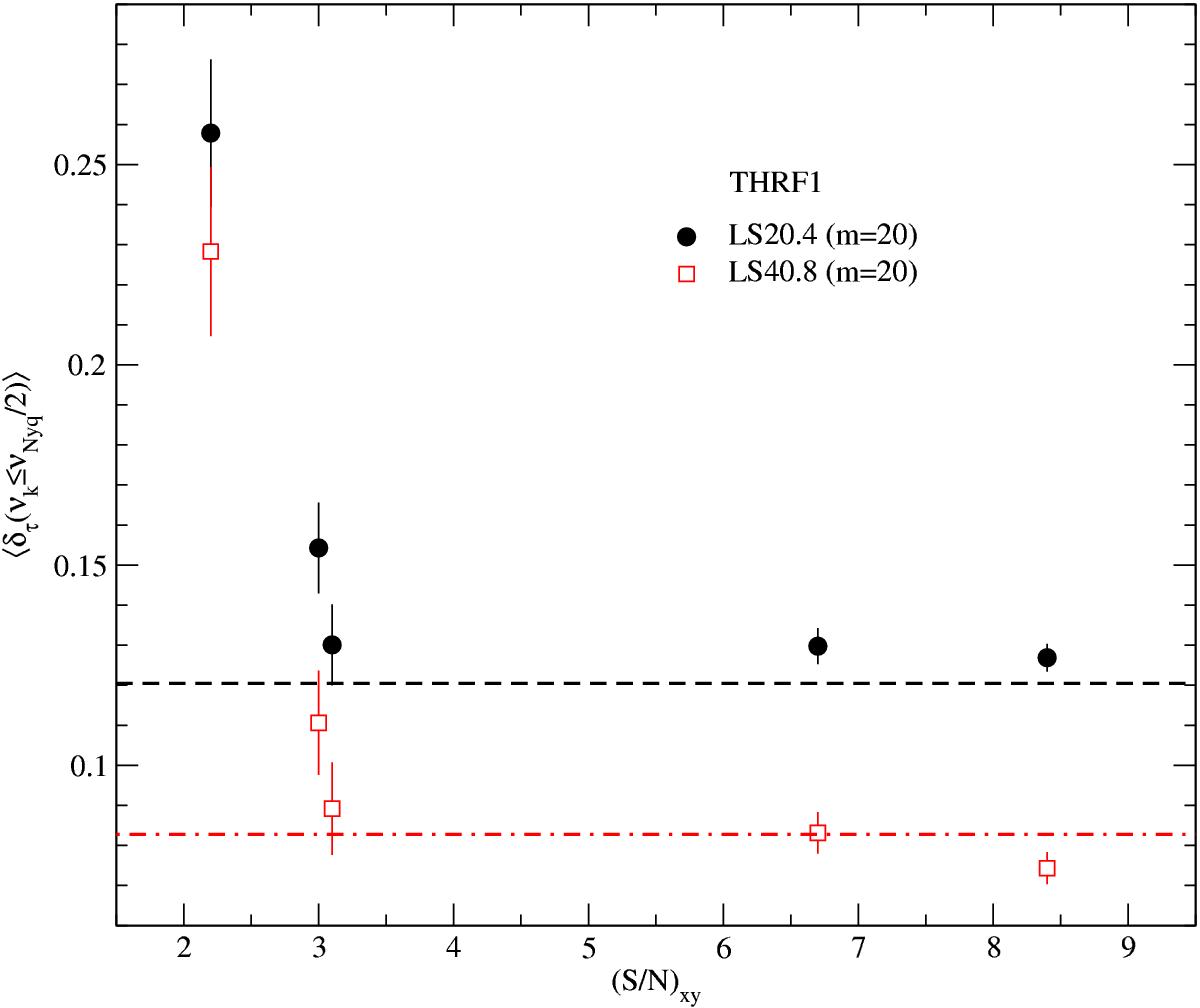
Relative bias of the averaged time-lag estimates for the LS20.4 and LS40.8 light curves, plotted as a function of (S/N)xy in experiment THRF1. The horizontal dashed lines correspond to the value of the relative bias when (S/N)xy → ∞.
Current usage metrics show cumulative count of Article Views (full-text article views including HTML views, PDF and ePub downloads, according to the available data) and Abstracts Views on Vision4Press platform.
Data correspond to usage on the plateform after 2015. The current usage metrics is available 48-96 hours after online publication and is updated daily on week days.
Initial download of the metrics may take a while.